Ecg eos is normal. Electrical axis of the heart (EOS)
The electrical axis of the heart (EOS) is a clinical parameter that is used in cardiology and is reflected in the electrocardiogram. Allows you to evaluate the electrical processes that set the heart muscle in motion and are responsible for its correct operation.
From the point of view of cardiologists, the chest is a three-dimensional coordinate system in which the heart is enclosed. Each of its contraction is accompanied by a number of bioelectrical changes, which determine the direction of the cardiac axis.
The direction of this indicator depends on various physiological and anatomical factors. The position +59 0 is considered the average norm. But normogram options fall into a wide range from +20 0 to +100 0.
Healthy Electric Axis shifts to the left under the following conditions:
- at the moment of deep exhalation;
- when the body position changes to horizontal, the internal organs exert pressure on the diaphragm;
- with a high-standing diaphragm - observed in hypersthenics (short, strong people).
Indicator shift to the right in the absence of pathology observed in such situations:
- at the end of a deep breath;
- when changing the position of the body to the vertical;
- in asthenics (tall, thin people), the vertical position of the EOS is the norm.
The location of the electrical axis is determined by the fact that the mass of the left ventricle under normal conditions is greater than the mass of the right half of the heart muscle. Due to this, electrical processes proceed more intensively in it, because the vector is directed towards it.
Diagnostics on the ECG
An electrocardiogram is the main tool for determining EOS. To detect changes in the location of the axis, use two equivalent ways. The first method is more often used by diagnosticians, the second method is more common among cardiologists and therapists.
Alpha Offset Detection
The value of the alpha angle directly shows the displacement of the EOS in one direction or another. To calculate this angle, find the algebraic sum of the Q, R and S waves in the first and third standard leads. To do this, measure the height of the teeth in millimeters, and when adding, the positive or negative value of a particular tooth is taken into account.

The value of the sum of the teeth from the first lead is found on the horizontal axis, and from the third - on the vertical one. The intersection of the resulting lines determines the alpha angle.
The use of this method of determination is suitable for those specialists who have an appropriate table at hand.
Visual Definition
A simpler and more visual way to determine the EOS - comparison of R and S waves in the first and third standard leads. If the absolute value of the R wave within one lead is greater than the value of the S wave, then one speaks of an R-type ventricular complex. If vice versa, then the ventricular complex is classified as S-type.
When the EOS deviates to the left, a picture of RI - SIII is observed, which means R-type ventricular complex in the first lead and S-type in the third. If the EOS is deviated to the right, then SI - RIII is determined on the electrocardiogram.
Establishing diagnosis
What does it mean if the electrical axis of the heart is deviated to the left? EOS displacement is not an independent disease. This is a sign of changes in the heart muscle or its conduction system, which lead to the development of the disease. The deviation of the electrical axis to the left indicates such violations:

- an increase in the size of the left ventricle -;
- malfunctions of the valves of the left ventricle, due to which the ventricle is overloaded with blood volume;
- cardiac blockade, for example, it looks like this, which you can learn about from another article);
- conduction disturbances within the left ventricle.
All of these factors lead to the fact that the left ventricle does not work correctly, the conduction of an impulse through the myocardium is impaired. As a result, the electrical axis deviates to the left.
Diseases that are accompanied by a levogram
If a patient has an EOS deviation, then this may be due to diseases such as:
- heart (CHD);
- cardiopathy of various origins;
- chronic heart failure (CHF) of the left ventricular type;
- hearts;
- myocardium;
- myocardium.
In addition to diseases, certain medications can lead to blockade of the conduction system of the heart.
Additional Research
The detection on the cardiogram of the EOS deviation to the left side is not in itself the basis for the final conclusion of the doctor. In order to determine what specific changes occur in the heart muscle, additional instrumental studies are required.
- Bicycle ergometry(electrocardiogram while walking on a treadmill or on an exercise bike). Test to detect ischemia of the heart muscle.
- ultrasound. With the help of ultrasound, the degree of ventricular hypertrophy and violations of their contractile function are assessed.
- . The cardiogram is removed during the day. Assign in cases of rhythm disturbance, which is accompanied by a deviation of the EOS.
- X-ray examination chest. With significant hypertrophy of myocardial tissues, an increase in the cardiac shadow in the picture is observed.
- Angiography of the coronary arteries (CAG). Allows you to determine the degree of damage to the coronary arteries in diagnosed coronary disease.
- echocardioscopy. Allows you to purposefully determine the state of the patient's ventricles and atria.
Treatment
Deviation of the electrical axis of the heart to the left of the normal position in itself is not a disease. This is a sign determined with the help of instrumental research, which allows you to identify violations in the work of the heart muscle.
The doctor makes the final diagnosis only after additional studies. Treatment tactics are aimed at eliminating the underlying disease.
Ischemia, heart failure, and some cardiopathies are treated with drugs. Additional diet and healthy lifestyle leads to the improvement of the patient's condition.
In severe cases, surgery is required, for example, with congenital or acquired heart defects. If the conduction system is severely damaged, it may be necessary to transplant a pacemaker, which will send signals directly to the myocardium and cause it to contract.
Most often, the deviation is not a threatening symptom. But if the axis changes its position abruptly, reaches values of more than 90 0, this may indicate blockade of the legs of the Hiss bundle and threatens with cardiac arrest. Such a patient requires urgent hospitalization in the intensive care unit. A sharp and pronounced deviation of the electrical axis of the heart to the left looks like this:

Detection of displacement of the electrical axis of the heart is not a cause for concern. But if this symptom is detected, you should immediately consult a doctor for further examination and identify the cause of this condition. Annual scheduled electrocardiography allows you to timely detect abnormalities in the work of the heart and immediately begin therapy.
There are many methods for diagnosing heart diseases, determining the effectiveness of this organ, among them is the definition of EOS. This abbreviation refers to the indicator of the electrical axis of the heart.
Description and characteristics
The definition of EOS is a diagnostic method that displays the electrical parameters of the heart. The value that determines the position of the electrical axis of the heart is a summed indicator of bioelectrical processes that occur during heart contractions. In cardiac diagnostics, the direction of the EOS is important.
The heart is a three-dimensional organ with volume. Its position in medicine is represented and determined in a virtual coordinate grid. Atypical myocardial fibers during their work intensively generate electrical impulses. It is an integral, electrically conductive system. It is from there that electrical impulses originate, causing the movement of parts of the heart and determining the rhythm of its work. For fractions of a second before contractions, changes in the electrical nature appear, forming the magnitude of the EOS.

EOS parameters, sinus rhythm shows a cardiogram; indicators are taken by a diagnostic apparatus with electrodes that are attached to the patient's body. Each of them picks up bioelectrical signals emitted by segments of the myocardium. By projecting the electrodes onto a coordinate grid in three dimensions, the angle of the electrical axis is calculated and determined. It passes through the places of localization of the most active electrical processes.
Concept and specificity
There are several options for the location of the electrical axis of the heart, it changes its position under certain conditions.
This does not always indicate disorders and diseases. In a healthy organism, depending on the anatomy, body composition, EOS deviates from 0 to +90 degrees (+30 ... +90 is considered the norm, with normal sinus rhythm).
The vertical position of the EOS is observed when it is in the range from +70 to +90 degrees. This is typical for people of thin build with high growth (asthenics).
Intermediate types of body composition are often observed. Accordingly, the position of the electrical axis of the heart also changes, for example, it becomes semi-vertical. Such displacements are not a pathology, they are inherent in people with normal body functions.
An example of the wording in the conclusion of the ECG may sound like this: “EOS is vertical, the rhythm is sinus, the heart rate is 77 per minute.” - is considered normal. It should be noted that the term "EOS rotation around the axis", which can be noted in the electrocardiogram, does not indicate any pathologies. By itself, such a deviation is not regarded as a diagnosis.

There is a group of ailments for which vertical EOS is characteristic:
- ischemia;
- cardiomyopathy of various nature, especially in dilated form;
- chronic heart failure;
- congenital anomalies.
Sinus rhythm in these pathologies is disturbed.
Left and right position
When the electrical axis is shifted to the left side, its myocardium is also hypertrophied (LVH). This is the most common specific deviation. Such a pathology acts as an additional symptomatology, and not independently, and indicates an overload of the ventricle and a change in the process of its work.
These problems appear with prolonged arterial hypertension.
The violation is accompanied by a significant load on the vessels that deliver blood to the organ, so the contractions of the ventricle occur with excessive force, its muscles increase and hypertrophy. The same is observed with ischemia, cardiomyopathy, etc.
The left location of the electrical axis and LVH is also observed in violations of the valvular system, while the sinus rhythm of contractions is also disturbed. The pathology is based on the following processes:
- when the exit of blood from the ventricle is difficult;
- weakness of the aortic valve, when some of the blood flows back into the ventricle and overloads it.
Marked violations - acquired or congenital. Often the cause of the first - transferred rheumatism. A change in the volume of the ventricle is also observed in people who are professionally involved in sports. They are strongly advised to consult a doctor to determine whether physical activity will cause irreparable harm to health.
Deviation to the left is also detected with impaired conduction inside the ventricle, during blockade disorders in the heart.
Hypertrophic processes of the right ventricle (HRH) accompany the right deviation of the EOS. The right side of the heart is responsible for the flow of blood to the lungs, where it is saturated with oxygen. BPH is characteristic of pathologies of the respiratory system: asthma, chronic obstructive processes in the lungs. If the disease proceeds for a long time, it causes hypertrophic changes in the ventricle.
Other causes of pathology are the same as for the left deviation: ischemia, disturbed rhythm, chronic heart failure, cardiomyopathy and blockade.
Consequences of displacement and their specifics
EOS shift is found on the cardiogram. Consultation with a cardiologist and additional studies are required when the deviation is outside the normal range, which is set in the range from 0 to +90 degrees.
The processes and factors involved in the displacement of the axis of the heart, accompanied by clinically pronounced symptoms, require additional examinations without fail. Particular attention should be paid to the circumstances when, with previously stable indicators of axis deviation, a change in the ECG suddenly occurs or the sinus rhythm is disturbed. This is one of the blockade symptoms.
By itself, the deviation of the EOS does not need therapeutic measures, it is classified as a cardiological parameter, requiring, first of all, to determine the cause of the occurrence. Only the cardiologist decides whether treatment is necessary in each individual case.
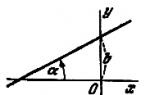
Electrical axis of the heart
The greatest electrical activity of the myocardium of the ventricles is found during their excitation. In this case, the resultant of the emerging electrical forces (vector) occupies a certain position in the frontal plane of the body, forming an angle a (it is expressed in degrees) relative to the horizontal zero line (I standard lead). The position of this so-called electrical axis of the heart (EOS) is estimated by the size of the QRS complex teeth in standard leads, which allows you to determine the angle a and, accordingly, the position of the electrical axis of the heart. Angle a is considered positive if it is below the horizontal line, and negative if it is above. This angle can be determined by geometric construction in Einthoven's triangle, knowing the size of the teeth of the QRS complex in two standard leads. In practice, special tables are used to determine the angle a (the algebraic sum of the teeth of the QRS complex in I and II standard leads is determined, and then the angle a is found from the table). There are five options for the location of the axis of the heart: normal, vertical position (intermediate between the normal position and rightogram), deviation to the right (rightogram), horizontal (intermediate between the normal position and leftogram), deviation to the left (leftogram).
All five options are schematically shown in Fig. 23–9.
Rice. 23–9 . Variants of deviation of the electrical axis of the heart. They are assessed by the size of the main (greatest amplitude) teeth of the QRS complex in leads I and III. PR - right hand, LR - left hand, LL - left leg.
· Normogram(normal position of the EOS) is characterized by an angle a from +30° to +70°. ECG signs:
Ú the R wave prevails over the S wave in all standard leads;
Ú maximum R wave in standard lead II;
Ú in aVL and aVF, R waves also predominate, and in aVF it is usually higher than in aVL.
Normogram formula: R II > R I > R III.
· Vertical position characterized by an angle a from +70° to +90°. ECG signs:
Ú equal amplitude of R waves in II and III standard leads (or in lead III slightly lower than in II);
Ú the R wave in the I standard lead is small, but its amplitude exceeds the amplitude of the S wave;
Ú the QRS complex in aVF is positive (high R wave predominates), and in aVL it is negative (deep S wave predominates).
Formula: R II ³R III >R I , R I >S I .
· Rightgram. Deviation of EOS to the right (right-hand diagram) - angle a is more than +90°. ECG signs:
Ú the R wave is maximal in standard lead III, in leads II and I it progressively decreases;
Ú the QRS complex in lead I is negative (the S wave predominates);
Ú in aVF, a high R wave is characteristic, in aVL - a deep S with a small R wave;
Formula: R III > R II > R I , S I > R I .
· Horizontal position characterized by an angle a from +30° to 0°. ECG signs:
Ú R waves in leads I and II are almost the same, or the R wave in lead I is slightly higher;
Ú in standard lead III, the R wave has a small amplitude, the S wave exceeds it (the r wave increases on inspiration);
Ú in aVL, the R wave is high, but somewhat smaller than the S wave;
Ú in aVF, the R wave is low, but exceeds the S wave.
Formula: R I ³R II > R III , S III > R III , R aVF > S aVF .
· Levogramma. EOS deviation to the left (leftogram) - angle a less than 0° (up to –90°). ECG signs:
Ú R wave in lead I exceeds R waves in II and III standard leads;
Ú the QRS complex in lead III is negative (the S wave predominates; sometimes the r wave is completely absent);
Ú in aVL, the R wave is high, almost equal to or greater than the R wave in I standard lead;
Ú in aVF, the QRS complex resembles that in standard lead III.
Formula: R I > R II > R III , S III > R III , R aVF
Approximate assessment of the position of the electrical axis of the heart. To memorize the differences between a right-gram and a left-gram, students use a witty school trick, which consists in the following. When examining their palms, the thumb and forefinger are bent, and the remaining middle, ring and little fingers are identified with the height of the R wave. They “read” from left to right, like a regular line. The left hand is a levogram: the R wave is maximum in standard lead I (the first highest finger is the middle one), decreases in lead II (ring finger), and is minimal in lead III (little finger). The right hand is a rightogram, where the situation is reversed: the R wave grows from lead I to lead III (as well as the height of the fingers: little finger, ring finger, middle finger).
Causes of deviation of the electrical axis of the heart. The position of the electrical axis of the heart depends on both cardiac and non-cardiac factors.
In people with a high standing diaphragm and / or a hypersthenic constitution, the EOS takes a horizontal position or even a levogram appears.
In tall, thin people with a low diaphragm, the EOS is normally located more vertically, sometimes up to the right gram.
EOS deviation is most often associated with pathological processes. As a result of the predominance of the mass of the myocardium, i.e. ventricular hypertrophy, EOS deviates towards a hypertrophied ventricle. However, if with hypertrophy of the left ventricle, the deviation of the EOS to the left almost always occurs, then in order to deviate it to the right, the right ventricle must be significantly hypertrophied, since its mass in a healthy person is 6 times less than the mass of the left ventricle. Nevertheless, it must immediately be pointed out that, despite the classical ideas, at present, EOS deviation is not considered a reliable sign of ventricular hypertrophy.
Heart arrhythmias
Unusual localization of pacemakers. The AV junction and other parts of the conduction system can, under unusual conditions, become cardiac pacemakers - pacemakers. Pathology of atrial and ventricular muscle fibers can reduce their resting MP and thereby facilitate the process of depolarization, which initiates repetitive spontaneous discharges. A simple but extremely illustrative experiment, demonstrating the hierarchy of heart pacemakers, each medical student performs on the heart of a frog, applying the so-called Stannius ligatures. The separation of the sinus venosus from the atria by ligatures, and the atria from the ventricles, causes the appearance of three separate sections in the heart, contracting at three different frequencies.
Heart blocks. If conduction between the atria and ventricles is slow, but not completely interrupted, then incomplete heart block is recorded. In first-degree AV block, all atrial impulses reach the ventricles, but the PQ(R) interval is unusually long (greater than 0.20 s). In second-degree AV block, not all atrial impulses are conducted to the ventricles. If the conduction of excitation from the atria to the ventricles is completely impaired, as happens with complete AV block (AV block of the III degree), then the ventricles work in their rare rhythm, regardless of the atrial rhythm.
Ectopic foci of excitation. Normally, cardiomyocytes are not spontaneously excited. The possibility of spontaneous discharges in the His bundle and Purkinje fibers is low, since normal discharges of sinus rhythm from the sinoatrial node occur much faster than spontaneous discharges in the His bundle and Purkinje fibers occur. Under unusual conditions, Purkinje fibers can spontaneously fire. If the ectopic focus is excited once, then the additional contraction occurs before the usual expected contraction of the heart and temporarily disrupts the rhythm (atrial or ventricular extrasystole, or premature contraction). If the ectopic focus is discharged repeatedly and its rate of excitation is higher than the rate of excitation of the cells of the sinoatrial node, then it causes atrial, ventricular or AV nodal paroxysmal tachycardia or atrial flutter. The most common cause of paroxysmal arrhythmia is a conduction defect, leading to a circular motion of the excitation wave through the myocardium.
V.S. ZADIONCHENKO, MD, Professor, G.G. SHEKHYAN, Ph.D., A.M. THICK, Ph.D., A.A. YALYMOV, Ph.D., GBOU VPO MGMSU them. A.I. Evdokimov of the Ministry of Health of Russia
This article presents modern views on ECG diagnostics in pediatrics. The team of authors reviewed some of the most characteristic changes that distinguish the ECG in childhood.
The normal ECG in children differs from the ECG in adults and has a number of specific features in each age period. The most pronounced differences are noted in young children, and after 12 years, the child's ECG approaches the adult's ECG.
Features of the heart rhythm in children
For childhood, a high heart rate (HR) is characteristic, newborns have the highest heart rate, as the child grows, it decreases. In children, there is a pronounced lability of the heart rate, the allowable fluctuations are 15–20% of the average age indicator. Sinus respiratory arrhythmia is often noted, the degree of sinus arrhythmia can be determined using Table 1.
The main pacemaker is the sinus node, however, the mid-atrial rhythm, as well as the migration of the pacemaker through the atria, are acceptable options for the age norm.
Features of the duration of ECG intervals in childhood
Given that children are characterized by a higher heart rate than adults, the duration of ECG intervals, waves and complexes decreases.
Change in the voltage of the teeth of the QRS complex
The amplitude of the ECG waves depends on the individual characteristics of the child: the electrical conductivity of the tissues, the thickness of the chest, the size of the heart, etc. In the first 5–10 days of life, there is a low voltage of the QRS complex teeth, which indicates a reduced electrical activity of the myocardium. In the future, the amplitude of these teeth increases. Starting from infancy and up to 8 years, a higher amplitude of the teeth is revealed, especially in the chest leads, this is associated with a smaller thickness of the chest, large sizes of the heart relative to the chest and turns of the heart around the axes, as well as a greater degree of adherence of the heart to the chest.
Features of the position of the electrical axis of the heart
In newborns and children in the first months of life, there is a significant deviation of the electrical axis of the heart (EOS) to the right (from 90 to 180°, on average 150°). At the age of 3 months. up to 1 year, in most children, the EOS goes into a vertical position (75–90 °), but significant fluctuations in the angle (from 30 to 120 °) are still allowed. By the age of 2, 2/3 of children still retain the vertical position of the EOS, and 1/3 have it normal (30–70°). In preschoolers and schoolchildren, as well as in adults, the normal position of the EOS prevails, but variants can be noted in the form of a vertical (more often) and horizontal (less often) position.
Such features of the position of the EOS in children are associated with a change in the ratio of masses and electrical activity of the right and left ventricles of the heart, as well as with a change in the position of the heart in the chest (rotations around the axes). In children of the first months of life, anatomical and electrophysiological predominance of the right ventricle is noted. With age, as the mass of the left ventricle advances and the heart turns with a decrease in the degree of adherence of the right ventricle to the surface of the chest, the position of the EOS moves from the right to the normogram. The ongoing changes can be judged by the ratio of the amplitude of the R and S waves in the standard and chest leads, which changes on the ECG, as well as by the shift of the transition zone. So, as children grow in standard leads, the amplitude of the R wave in lead I increases, and in lead III it decreases; the amplitude of the S wave, on the contrary, decreases in lead I, and increases in lead III. In the chest leads, with age, the amplitude of the R waves in the left chest leads (V4-V6) increases and decreases in the leads V1, V2; the depth of the S waves increases in the right chest leads and decreases in the left ones; the transitional zone gradually shifts from V5 in newborns to V3, V2 after the 1st year. All this, as well as an increase in the interval of internal deviation in lead V6, reflects the increasing electrical activity of the left ventricle with age and the rotation of the heart around the axes.
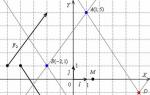
In newborn children, large differences are revealed: the electric axes of the P and T vectors are located almost in the same sector as in adults, but with a slight shift to the right: the direction of the P vector is 55 ° on average, the T vector is 70 ° on average, while the QRS vector is sharply deviated to the right (average 150°). The value of the adjacent angle between the electrical axes P and QRS, T and QRS reaches a maximum of 80–100°. This partly explains the differences in the size and direction of the P waves, and especially the T waves, as well as the QRS complex in newborns.
With age, the value of the adjacent angle between the electric axes of the P and QRS, T and QRS vectors decreases significantly: in the first 3 months. life on average up to 40–50°, in young children - up to 30°, and at preschool age it reaches 10–30°, as in schoolchildren and adults (Fig. 1).
In adults and school-age children, the position of the electrical axes of the total atrial vectors (P vector) and ventricular repolarization (T vector) relative to the ventricular vector (QRS vector) is in the same sector from 0 to 90 °, and the direction of the electrical axis of the P vectors (average 45 –50°) and T (on average 30–40°) does not differ sharply from the orientation of the EOS (the QRS vector is on average 60–70°). Between the electric axes of the vectors P and QRS, T and QRS, an adjacent angle of only 10–30° is formed. This position of the listed vectors explains the same (positive) direction of the P and T waves with the R wave in most leads on the ECG.
Peculiarities of teeth of intervals and complexes of children's ECG
Atrial complex (P wave). In children, as in adults, the P wave is small (0.5–2.5 mm), with a maximum amplitude in I, II standard leads. In most leads it is positive (I, II, aVF, V2-V6), in lead aVR it is always negative, in leads III, aVL, V1 it can be smoothed, biphasic or negative. In children, a slightly negative P wave is also acceptable in lead V2.
The greatest features of the P wave are observed in newborns, which is explained by increased electrical activity of the atria due to the conditions of intrauterine circulation and its postnatal restructuring. In newborns, the P wave in standard leads is relatively high (but not more than 2.5 mm in amplitude), pointed, sometimes it can have a small notch at the top as a result of non-simultaneous excitation coverage of the right and left atria (but not more than 0 .02–0.03 s). As the child grows, the amplitude of the P wave decreases slightly. With age, the ratio of the size of the P and R waves in standard leads also changes. In newborns, it is 1: 3, 1: 4; as the amplitude of the R wave increases and the amplitude of the P wave decreases, this ratio decreases to 1: 6 by 1–2 years, and after 2 years it becomes the same as in adults: 1: 8; 1:10. The smaller the child, the shorter the duration of the P wave. It increases on average from 0.05 s in newborns to 0.09 s in older children and adults.
Features of the PQ interval in children. The duration of the PQ interval depends on the heart rate and on age. As children grow, there is a noticeable increase in the duration of the PQ interval: on average, from 0.10 s (no more than 0.13 s) in newborns to 0.14 s (no more than 0.18 s) in adolescents and in adults 0.16 s (no more than 0.20 s).
Features of the QRS complex in children. In children, the ventricular excitation coverage time (QRS interval) increases with age: on average, from 0.045 s in newborns to 0.07–0.08 s in older children and adults.
In children, as in adults, the Q wave is recorded intermittently, more often in II, III, aVF, left chest (V4-V6) leads, less often in leads I and aVL. In lead aVR, a deep and wide Q wave of the Qr type or the QS complex is determined. In the right chest assignments Q waves, as a rule, are not registered. In young children, the Q wave in I, II standard leads is often absent or weakly expressed, and in children of the first 3 months. - also in V5, V6. Thus, the frequency of registration of the Q wave in various leads increases with the age of the child.
In standard lead III, in all age groups, the Q wave is also on average small (2 mm), but can be deep and reach up to 5 mm in newborns and infants; at early and preschool age - up to 7–9 mm, and only in schoolchildren it begins to decrease, reaching a maximum of 5 mm. Sometimes, in healthy adults, a deep Q wave is recorded in standard lead III (up to 4–7 mm). In all age groups of children, the Q wave in this lead may exceed 1/4 of the R wave.
In lead aVR, the Q wave has a maximum depth that increases with the age of the child: from 1.5–2 mm in newborns to 5 mm on average (with a maximum of 7–8 mm) in infants and infancy, to 7 mm on average (with a maximum of 11 mm) in preschoolers and up to 8 mm on average (with a maximum of 14 mm) in schoolchildren. The duration of the Q wave should not exceed 0.02–0.03 s.
In children, as well as in adults, R waves are usually recorded in all leads, only in aVR they can be small or absent (sometimes in lead V1). There are significant fluctuations in the amplitude of the R waves in various leads from 1–2 to 15 mm, but the maximum value of the R waves in standard leads is up to 20 mm, and in the chest leads up to 25 mm. The smallest value of the R waves is observed in newborns, especially in enhanced unipolar and chest leads. However, even in newborns, the amplitude of the R wave in standard lead III is quite large, since the electrical axis of the heart is deviated to the right. After 1 month the amplitude of the RIII wave decreases, the size of the R waves in the other leads gradually increases, especially noticeable in the II and I standard and in the left (V4-V6) chest leads, reaching a maximum at school age.
In the normal position of the EOS, high R waves with a maximum of RII are recorded in all limb leads (except aVR). In the chest leads, the amplitude of the R waves increases from left to right from V1 (r wave) to V4 with a maximum of RV4, then it decreases slightly, but the R waves in the left chest leads are higher than in the right ones. Normally, the R wave may be absent in lead V1, and then a QS complex is recorded. In children, a QS type complex is also rarely allowed in leads V2, V3.
In newborns, electrical alternation is allowed - fluctuations in the height of the R waves in the same lead. Variants of the age norm also include respiratory alternation of ECG teeth.
In children, deformation of the QRS complex in the form of the letters "M" or "W" in the III standard and V1 leads is common in all age groups, starting from the neonatal period. At the same time, the duration of the QRS complex does not exceed the age norm. The splitting of the QRS complex in healthy children in V1 is referred to as "syndrome of delayed excitation of the right supraventricular crest" or "incomplete right bundle branch block". The origin of this phenomenon is associated with the excitation of the hypertrophied right "supraventricular scallop", located in the region of the pulmonary conus of the right ventricle, which is excited by the latter. Also important is the position of the heart in the chest and the electrical activity of the right and left ventricles that changes with age.
The interval of internal deviation (time of activation of the right and left ventricles) in children varies as follows. The activation time of the left ventricle (V6) increases from 0.025 s in newborns to 0.045 s in schoolchildren, reflecting the outstripping increase in the mass of the left ventricle. The activation time of the right ventricle (V1) practically does not change with the age of the child, amounting to 0.02–0.03 s.
In young children, there is a change in the localization of the transition zone due to a change in the position of the heart in the chest and a change in the electrical activity of the right and left ventricles. In newborns, the transition zone is located in lead V5, which characterizes the dominance of the electrical activity of the right ventricle. At the age of 1 month. there is a shift of the transition zone into leads V3, V4, and after 1 year it is localized in the same place as in older children and adults - in V3 with fluctuations in V2-V4. Together with an increase in the amplitude of the R waves and a deepening of the S waves in the corresponding leads and an increase in the activation time of the left ventricle, this reflects an increase in the electrical activity of the left ventricle.
Both in adults and in children, the amplitude of the S waves in different leads varies widely: from the absence in a few leads to 15–16 mm as much as possible, depending on the position of the EOS. The amplitude of the S waves changes with the age of the child. Newborns have the smallest S-wave depth in all leads (from 0 to 3 mm), except for standard I, where the S wave is deep enough (7 mm on average, up to a maximum of 13 mm).
In children older than 1 month the depth of the S wave in standard lead I decreases, and later in all leads from the extremities (except aVR), small amplitude S waves (from 0 to 4 mm) are recorded, just like in adults. In healthy children, in leads I, II, III, aVL and aVF, the R-waves are usually larger than the S-waves. As the child grows, the S-waves deepen in the V1-V4 chest leads and in the aVR lead, reaching a maximum value at senior school age. In the left chest leads V5-V6, on the contrary, the amplitude of the S waves decreases, often they are not recorded at all. In chest leads, the depth of the S waves decreases from left to right from V1 to V4, with the greatest depth in leads V1 and V2.
Sometimes in healthy children with an asthenic physique, with the so-called. "hanging heart", S-type ECG is recorded. At the same time, the S waves in all standard (SI, SII, SIII) and chest leads are equal to or exceed the R waves with a reduced amplitude. It is believed that this is due to the rotation of the heart around the transverse axis with the apex backwards and around the longitudinal axis with the right ventricle forward. In this case, it is practically impossible to determine the angle α, and therefore it is not determined. If the S-waves are shallow and there is no shift of the transition zone to the left, then it can be assumed that this is a variant of the norm, more often the S-type ECG is determined in pathology.
The ST segment in children, as well as in adults, should be on the isoline. It is allowed to shift the ST segment up and down up to 1 mm in the limb leads and up to 1.5–2 mm in the chest leads, especially in the right leads. These shifts do not mean pathology if there are no other changes on the ECG. In newborns, the ST segment is often not expressed, and the S wave, when it reaches the isoline, immediately passes into a gently rising T wave.
In older children, as in adults, T waves are positive in most leads (in standard I, II, aVF, V4-V6). In standard III and aVL leads, T waves may be flattened, biphasic, or inverted; in the right chest leads (V1-V3) are often negative or smoothed; in lead aVR, they are always negative.
The greatest differences in T waves are observed in newborns. They have low-amplitude T waves (from 0.5 to 1.5–2 mm) or smoothed in standard leads. In a number of leads, where T waves in children of other age groups and adults are normally positive, they are negative in newborns, and vice versa. So, newborns may have negative T waves in I, II standard, in reinforced unipolar and in the left chest leads; may be positive in the III standard and right chest leads. By the 2-4th week. In life, T wave inversion occurs, i.e. in I, II standard, aVF and left chest (except V4) leads they become positive, in the right chest and V4 - negative, in III standard and aVL can be smoothed, biphasic or negative.
In subsequent years, negative T waves persist in lead V4 up to 5-11 years, in lead V3 - up to 10-15 years, in lead V2 - up to 12-16 years, although negative T waves in leads V1 and V2 are allowed in some cases and in healthy adults.
After 1 month life, the amplitude of the T waves gradually increases, ranging from 1 to 5 mm in standard leads in young children and from 1 to 8 mm in chest leads. In schoolchildren, the size of the T waves reaches the level of adults and ranges from 1 to 7 mm in standard leads and from 1 to 12–15 mm in chest leads. The T wave has the largest value in lead V4, sometimes in V3, and in leads V5, V6 its amplitude decreases.
The QT interval (ventricular electrical systole) makes it possible to assess the functional state of the myocardium. The following features of electrical systole in children can be distinguished, reflecting the electrophysiological properties of the myocardium that change with age.
An increase in the duration of the QT interval as the child grows from 0.24–0.27 s in newborns to 0.33–0.4 s in older children and adults. With age, the ratio between the duration of the electrical systole and the duration of the cardiac cycle changes, which reflects the systolic index (SP). In newborns, the duration of electrical systole takes more than half (SP = 55–60%) of the duration of the cardiac cycle, and in older children and adults it is 1/3 or slightly more (37–44%), i.e., SP decreases with age.
With age, the ratio of the duration of the electrical systole phases changes: the excitation phase (from the beginning of the Q wave to the beginning of the T wave) and the recovery phase, that is, rapid repolarization (the duration of the T wave). In newborns, recovery processes in the myocardium take more time than the excitation phase. In young children, these phases take approximately the same time. In 2/3 of preschoolers and the majority of schoolchildren, as well as in adults, more time is spent on the excitation phase.
ECG features in different age periods of childhood
Neonatal period (Fig. 2).
1. In the first 7-10 days of life, there is a tendency to tachycardia (heart rate 100-120 beats / min), followed by an increase in heart rate to 120-160 beats / min. Pronounced lability of heart rate with large individual fluctuations.
2. Decrease in the voltage of the QRS complex teeth in the first 5–10 days of life, followed by an increase in their amplitude.
3. Deviation of the electrical axis of the heart to the right (angle α 90–170°).
4. The P wave is relatively larger (2.5-3 mm) in comparison with the teeth of the QRS complex (P / R ratio 1: 3, 1: 4), often pointed.
5. The PQ interval does not exceed 0.13 s.
6. The Q wave is unstable, as a rule, is absent in the I standard and in the right chest (V1-V3) leads, it can be deep up to 5 mm in the III standard and aVF leads.
7. The R wave in standard lead I is low, and in standard lead III it is high, while RIII > RII > RI, high R waves in aVF and right chest leads. The S wave is deep in I, II standard, aVL and in the left chest leads. The above reflects the deviation of the EOS to the right.
8. There is a low amplitude or smoothness of the T waves in the limb leads. In the first 7–14 days, the T waves are positive in the right chest leads, and in I and in the left chest leads they are negative. By the 2-4th week. life, the inversion of the T waves occurs, i.e. in the I standard and left chest they become positive, and in the right chest and V4 - negative, remaining so in the future until school age.
Breast age: 1 month. – 1 year (Fig. 3).
1. Heart rate decreases slightly (average 120–130 beats/min) while maintaining rhythm lability.
2. The voltage of the QRS complex teeth increases, often it is higher than in older children and adults, due to the smaller thickness of the chest.
3. In most infants, the EOS goes into a vertical position, some children have a normogram, but significant fluctuations in the angle α (from 30 to 120 °) are still allowed.
4. The P wave is clearly expressed in I, II standard leads, and the ratio of the amplitude of the P and R teeth decreases to 1: 6 due to an increase in the height of the R wave.
5. The duration of the PQ interval does not exceed 0.13 s.
6. The Q wave is recorded intermittently, often absent in the right chest leads. Its depth increases in III standard and aVF leads (up to 7 mm).
7. The amplitude of the R waves increases in the I, II standard and in the left chest (V4-V6) leads, and in the III standard it decreases. The depth of the S waves decreases in standard I and in the left chest leads and increases in the right chest leads (V1-V3). However, in VI, the amplitude of the R wave, as a rule, still prevails over the size of the S wave. These changes reflect the shift of the EOS from a right-handed image to a vertical position.
8. The amplitude of the T waves increases, and by the end of the 1st year, the ratio of the T and R teeth is 1: 3, 1: 4.
ECG in young children: 1-3 years (Fig. 4).
1. Heart rate decreases to an average of 110-120 beats / min, some children develop sinus arrhythmia.
3. The position of the EOS: 2/3 of the children maintain a vertical position, and 1/3 have a normogram.
4. The ratio of the amplitude of the P and R waves in I, II standard leads decreases to 1: 6, 1: 8 due to the growth of the R wave, and after 2 years it becomes the same as in adults (1: 8, 1: 10) .
5. The duration of the PQ interval does not exceed 0.14 s.
6. Q waves are often shallow, but in some leads, especially in standard III, their depth becomes even greater (up to 9 mm) than in children of the 1st year of life.
7. The same changes in the amplitude and ratio of the R and S waves that were noted in infants continue, but they are more pronounced.
8. There is a further increase in the amplitude of the T waves, and their ratio with the R wave in I, II leads reaches 1: 3 or 1: 4, as in older children and adults.
9. Negative T waves are preserved (options - two-phase, smoothness) in the III standard and right chest leads up to V4, which is often accompanied by a downward displacement of the ST segment (up to 2 mm).
ECG in preschoolers: 3–6 years (Fig. 5).
1. Heart rate decreases to an average of 100 beats / min, moderate or severe sinus arrhythmia is often recorded.
2. The high voltage of the QRS complex teeth is preserved.
3. EOS is normal or vertical, and very rarely there is a deviation to the right and a horizontal position.
4. PQ duration does not exceed 0.15 s.
5. Q waves in various leads are recorded more often than in previous age groups. Relatively large depth of Q waves in standard III and aVF leads (up to 7–9 mm) is preserved compared to that in older children and adults.
6. The ratio of the size of the R and S teeth in standard leads changes towards an even greater increase in the R wave in I, II standard leads and a decrease in the depth of the S wave.
7. The height of the R waves in the right chest leads decreases, and in the left chest leads it increases. The depth of the S waves decreases from left to right from V1 to V5 (V6).
ECG in schoolchildren: 7–15 years old (Fig. 6).
The ECG of schoolchildren approaches the ECG of adults, but there are still some differences:
1. Heart rate decreases on average in younger students to 85–90 beats/min, in older students - up to 70–80 beats/min, but heart rate fluctuations are noted over a wide range. Moderately severe and severe sinus arrhythmia is often recorded.
2. The voltage of the QRS complex teeth decreases somewhat, approaching the same in adults.
3. The position of the EOS: more often (50%) - normal, less often (30%) - vertical, rarely (10%) - horizontal.
4. The duration of ECG intervals approaches that of adults. The PQ duration does not exceed 0.17–0.18 s.
5. The characteristics of the P and T waves are the same as in adults. T-wave inversion persists in lead V4 until 5–11 years of age, in V3 until 10–15 years of age, and in V2 until 12–16 years of age, although T-wave inversion in leads V1 and V2 is acceptable in healthy adults.
6. The Q wave is recorded intermittently, but more often than in young children. Its value becomes smaller than in preschool children, but in lead III it can be deep (up to 5–7 mm).
7. The amplitude and ratio of the R and S waves in various leads approach those in adults.
Conclusion
To summarize, the following features of a pediatric electrocardiogram can be distinguished:
1. Sinus tachycardia, from 120-160 beats / min in the neonatal period to 70-90 beats / min by the senior school age.
2. Large variability in heart rate, often - sinus (respiratory) arrhythmia, respiratory electrical alteration of QRS complexes.
3. The norm is the average, lower atrial rhythm and the migration of the pacemaker through the atria.
4. Low QRS voltage in the first 5–10 days of life (low electrical activity of the myocardium), then an increase in the amplitude of the waves, especially in the chest leads (due to the thin chest wall and the large volume occupied by the heart in the chest).
5. Deviation of the EOS to the right up to 90-170º during the neonatal period, by the age of 1-3 years - the transition of the EOS to a vertical position, by adolescence in about 50% of cases - normal EOS.
6. Short intervals and teeth of the PQRST complex with a gradual increase with age to normal boundaries.
7. "Syndrome of delayed excitation of the right supraventricular scallop" - splitting and deformation of the ventricular complex in the form of the letter "M" without increasing its duration in leads III, V1.
8. Pointed high (up to 3 mm) P wave in children of the first months of life (due to the high functional activity of the right heart in the prenatal period).
9. Often - deep (amplitude up to 7–9 mm, more than 1/4 of the R wave) Q wave in leads III, aVF in children up to adolescence.
10. Low amplitude of T waves in newborns, its increase by the 2-3rd year of life.
11. Negative, biphasic, or flattened T waves in leads V1-V4 that persist until the age of 10–15 years.
12. Shift of the transition zone of the chest leads to the right (in newborns - in V5, in children after the 1st year of life - in V3-V4) (Fig. 2-6).
Bibliography:
1. Heart disease: A guide for doctors / ed. R.G. Oganova, I.G. Fomina. M.: Litterra, 2006. 1328 p.
2. Zadionchenko V.S., Shekhyan G.G., Shchikota A.M., Yalymov A.A. A practical guide to electrocardiography. M.: Anacharsis, 2013. 257 p.: ill.
3. Isakov I.I., Kushakovsky M.S., Zhuravleva N.B. Clinical electrocardiography. L.: Medicine, 1984.
4. Kushakovsky M.S. Arrhythmias of the heart. St. Petersburg: Hippocrates, 1992.
5. Orlov V.N. Guide to electrocardiography. M.: Medical Information Agency, 1999. 528 p.
6. Guide to electrocardiography / ed. h. d.n. RF, prof. V.S. Zadionchenko. Saarbrucken, Germany. Lap Lambert Academic Publishing GmbH&Co. KG, 2011, p. 323.
7. Fazekas T.; Liszkai G.; Rudas L.V. Electrocardiographic Osborn wave in hypothermia // Orv. Hetil. 2000 Oct. 22 Vol. 141(43). P. 2347–2351.
8. Yan G.X., Lankipalli R.S., Burke J.F. et al. Ventricular repolarization components on the electrocardiogram: Cellular basis and clinical significance // J. Am. Coll. cardiol. 2003. No. 42. P. 401–409.
The electrical axis of the heart (EOS) is a concept that implies the activity of conducting nerve excitations synthesized and performed in the heart.
This indicator is characterized by the amount of conduction of electrical signals through the cavities of the heart, occurring with any contraction of the heart tissues.
The electrical axis of the heart is one of the characteristics determined by the ECG. To make a diagnosis, it is necessary to conduct additional hardware studies.
During an electrocardiogram study, the device captures nerve excitations emitted by different parts of the heart by applying electrocardiograph sensors to different parts of the chest.
To calculate the direction of the EOS, doctors use a coordinate system, comparing the location of the heart with it. Due to the projection of electrodes onto it, the angle of the EOS is calculated.
In places where the zone of the heart muscle, in which the electrode is installed, emits stronger nerve excitations, there is the EOS angle.
Why is the normal conduction of electrical excitations of the heart so important?
The fibers that make up the heart perfectly conduct nerve excitations, and with their multitude create the cardiac system, where they conduct these nervous excitations.
The initial functioning of the heart muscle begins in the sinus node, with the appearance of nervous excitation. Next, the nerve signal is transported to the ventricular node, which transmits the signal to the bundle of His, through which the signal propagates further.

The location of the latter is localized in the septum separating the two ventricles, where it branches into the anterior and posterior legs.
The nervous excitation conduction system is very important for the healthy functioning of the heart, because, thanks to electrical impulses, it sets the normal rhythm of heart contractions, which sets the healthy functioning of the body.
If deviations appear in the signal conduction structure, then significant deviations in the position of the EOS are possible.
How is the electrical axis of the heart determined?
 Reveal the location of the EOS, subject to the attending physician, deciphering the ECG using diagrams and tables, and finding the alpha angle.
This angle is formed from two straight lines. One of them is the 1st axis of abduction, and the second is the line of the vector of the electrical axis of the heart.
Location features include:
| Normal | If the location of the angle is within plus thirty - plus sixty nine, then this indicates normal indicators of the electrical axis of the heart |
| Vertical EOS | Registered when defining the axis within seventy - ninety degrees |
| Horizontal | When the angle is in the range from zero to thirty degrees |
| Offset to the left | The position of the ventricle is within an angle from zero to minus ninety degrees |
| Offset right | It is registered with indicators of the position of the ventricle in the range from ninety-one to one hundred and eighty. |
Another way to identify the electrical axis of the heart is to compare QRS complexes, the main task of which is the synthesis of nerve excitations and contraction of the ventricles.
Definition indicators are given below:
| Normal | With these electrical axis values, the R-wave of the second lead is larger than the R-wave in the first lead, and the similar tooth of the third compartment is smaller than in the first. (R2>R1>R3) |
| Left Deviation | If the normal position of the electrical axis is violated to the left side, the R-tooth of the first compartment is recorded - the largest, and the second and third, respectively, are smaller. (R1>R2>R3) |
| Right Deviation | Violation of the electrical axis of the heart to the right side is characterized by the largest third R-wave, and a corresponding decrease in the second and first. (R1 |
To accurately determine the height of the teeth, if they are approximately at the same level, use the following technique:
- QRS complexes are determined in leads 1 and 3;
- The height of the R-teeth of the 1st lead is summarized;
- A similar operation is performed with the R-teeth of the 3rd lead;
- The resulting sums are inserted into a certain table, the data joining point corresponding to a certain corner radius is identified. By identifying the normal values of the alpha angle, you can easily determine the location of the EOS.

You can also determine the position of the electric axis with a pencil. This method is not accurate enough, and is used, in many cases, by students.
To determine in this way, attach the back of the pencil to the results of the electrocardiogram in the places of three leads and determine the highest R-wave.
After that, the sharp side of the pencil is directed to the R-wave, to the lead, where it is as large as possible.
Normal indicators of EOS
The boundaries of normal levels of the electrical axis of the heart are determined by the study of the electrocardiogram.
In weight ratio, the right ventricle is larger than the left. Therefore, in the latter, nervous excitations are much stronger, which directs the EOS to it.
If we compare the heart with the coordinate system, then its position will be in the range from thirty to seventy degrees.
This arrangement is normal for the axis. But its position can fluctuate from zero to ninety degrees, which varies from the personal parameters of the human body:
- Horizontal. In the majority of cases, it is recorded in people of short stature, but with a wide sternum;
- Vertical. Mostly recorded in people of high stature, but thin build.

When fixing the electrical axis of the heart, the above positions are rarely noted. Semi-horizontal and semi-vertical positions of the axis are recorded in the predominant number of cases.
All of the above location options are normal indicators. Turns of the heart on the projection on the coordinate system will help determine the location of the heart, and diagnose possible diseases.
In the results of the electrocardiogram, rotations of the EOS around the coordinate axis can be recorded, which may be the norm. Such cases are considered individually, depending on the symptoms, condition, complaints of the patient and the results of other examinations.
Violations of the norm indicators are deviations to the left or right.
Normal indicators in children
For infants, he notes a clear axis shift on the ECG, in the process of growth it normalizes. For a period of one year from birth, the indicator is usually located vertically. Normalization of the position is characterized by an increase and development of the left ventricle.
In children of school and preschool age, the normal electrical axis of the heart predominates, and there is also a vertical and very rarely horizontal.
Norms for children:
- Infants, ninety to one hundred and seventy degrees;
- Children from one to three years old - the vertical position of the axis;
- Adolescent children - the normal position of the axis.

What is the purpose of EOS?
Only one displacement of the electrical axis of the heart does not diagnose the disease. This factor is one of the parameters on the basis of which abnormalities in the body can be diagnosed.
In certain pathologies, axis deviation is most characteristic.
These include:
- insufficient supply of blood to the heart;
- Primary damage to the heart muscle, not associated with inflammatory, tumor, ischemic lesions;
- Heart failure;
- Heart defects.


What does EOS shift to the right mean?
Complete blockade of the posterior branch of the bundle of His also leads to a violation of the electrical axis to the right. In the case of registering a right-sided displacement, a pathological increase in the dimension of the right ventricle, which is responsible for supplying blood to the lungs, is possible for oxygen saturation.
This disease is caused by narrowing of the arteries of the lung and insufficiency of the tricuspid valve.
Pathological growth of the right ventricle occurs with ischemia and / or heart failure, and other diseases that do not occur under the influence of inflammatory and ischemic processes.

What does the displacement of the EOS to the left mean?
When determining the displacement of the electrical axis to the left side, it may indicate a pathological increase in the left ventricle, as well as its overload.
This pathological condition, in most cases, is provoked by the following factors of influence:
- Persistent increase in blood pressure, which leads to the fact that the ventricle contracts much more strongly. Such a process leads to the fact that it grows in weight, and, accordingly, in size;
- Ischemic attacks;
- Heart failure;
- Primary heart lesions not associated with ischemic and inflammatory processes;
- Left ventricular valve disease. It involves the narrowing of the largest vessel in the human body - the aorta, in which the normal ejection of blood from the left ventricle is disrupted, and its valve insufficiency, when some part of the blood is thrown back into the left ventricle;
- People involved in sports at a professional level. In this case, it is necessary to consult a sports doctor about further sports activities.
Violation of the normal boundaries of the electrical axis can be both a congenital indicator and an acquired one. In most situations, heart defects are the consequences of a fever caused by rheumatism.
Also, displacements of the electrical axis to the left side can appear with a displacement of the conduction of nerve excitations inside the ventricles, and blockade of the anterior leg of the His bundle.

Symptoms
A separate displacement of the EOS does not entail any symptoms. But since it occurs as a consequence of some pathological condition, the symptoms correspond to the disease present in the body.
The most common symptoms are:

If you find the slightest symptoms, you should seek the advice of a cardiologist. Timely diagnosis and effective treatment can save a patient's life.
Diagnostics
To diagnose diseases associated with a violation of the electrical axis of the heart, it is required to conduct several hardware studies, in addition to the ECG, to confirm the diagnosis.
These include:
- Ultrasound examination (ultrasound). It is a method that provides a large amount of information about the state of the heart, in which it is possible to determine structural disorders in the heart. During this examination, a visual picture of the state of the heart is displayed on the screen, which will help diagnose enlargement. The method is safe and painless, which makes it available to any category of people, including infants and pregnant women;
- Daily electrocardiogram. Allows you to determine the slightest disturbances in the work of the heart, by the method of research by an electrocardiograph throughout the day;
- MRI of the heart- is a very complex type of safe research and is very effective. Many mistakenly think that it is associated with ionizing radiation, but it is not. The basis of MRI is a magnetic field, as well as radio frequency pulses. During the examination, the patient is placed in a special apparatus - a tomograph;
- Load tests (treadmill, bicycle ergometry). A treadmill is a study during exercise on a special type of treadmill. Bicycle ergometer - a similar way to check, but with the help of a special bike;
- X-ray of the sternum. During this method of research, the patient is irradiated with x-rays. The results help determine the enlargement of the heart;
- Coronography.
The choice of research method belongs to the attending physician, depending on the patient's complaints and symptoms.
Treatment
All the diseases listed in this article can be diagnosed by only one violation of the electrical axis. If a shift is detected, it is necessary to consult a cardiologist and conduct additional studies.
Registration of a violation in one direction or another does not require treatment.
It normalizes after the initial pathological condition is eliminated. And only by eliminating it, the indicators of the electric axis return to normal.
What could be the consequences?
The onset of burdens depends on the disease that provoked the deviation of the electrical axis.
Due to insufficient blood supply to the heart (ischemia), the following complications can progress:
- Tachycardia. A pathological increase in the rate of contractions of the heart occurs when the myocardium does not have enough blood volume for healthy work, which it tries to compensate for in a large number of contractions;
- Death of heart tissue. The progression of a heart attack due to prolonged oxygen starvation, provoked by insufficient blood supply to the heart, is inevitable;
- Circulation failure in the body. Against the background of circulatory failures in the body, blood stagnation, tissue death of vital organs, gangrene and other irreversible complications can progress;
- Violation of the structure of the heart;
- Fatal outcome. Extensive myocardial infarction and other serious burdens can lead to rapid death.
To prevent the development of serious complications and to prevent possible unexpected death, if symptoms are detected, you should immediately go to the hospital.
Examinations will help doctors to correctly diagnose the disease, and prescribe effective therapy or surgery.