Central pulse wave: pathophysiology and clinical significance. Device for measuring the propagation velocity of the pulse wave of blood flow The velocity of the pulse wave in patients and healthy people
At the moment of systole, a certain amount of blood enters the aorta, the pressure in its initial part rises, the walls stretch. Then the pressure wave and its accompanying stretching of the vascular wall propagate further to the periphery and are defined as a pulse wave. Thus, with the rhythmic ejection of blood by the heart, successively propagating pulse waves arise in the arterial vessels. Pulse waves propagate in the vessels at a certain speed, which, however, by no means reflects the linear velocity of blood flow. These processes are fundamentally different. Sali (N. Sahli) characterizes the pulse of the peripheral arteries as "a wave-like movement that occurs due to the propagation of the primary wave formed in the aorta towards the periphery."
Determining the propagation velocity of a pulse wave, according to many authors, is the most reliable method for studying the elastic-viscous state of blood vessels.
To determine the propagation velocity of the pulse wave, sphygmograms are simultaneously recorded from the carotid, femoral, and radial arteries (Fig. 10). Receivers (sensors) of the pulse are installed: on the carotid artery - at the level of the upper edge of the thyroid cartilage, on the femoral artery - at the point of its exit from under the pupart ligament, on the radial artery - at the site of palpation of the pulse. The correctness of the imposition of pulse sensors is controlled by the position and deviations of the "bunnies" on the visual screen of the device.
If the simultaneous recording of all three pulse curves is impossible for technical reasons, then the pulse of the carotid and femoral arteries is recorded simultaneously, and then the carotid and radial arteries. To calculate the speed of propagation of a pulse wave, you need to know the length of the segment of the artery between the pulse receivers. Measurements of the length of the section along which the pulse wave propagates in elastic vessels (Le) (aorta-iliac artery) are made in the following order (Fig. 11):
Fig.11. Determination of distances between pulse receivers - “sensors” (according to V.P. Nikitin). Designations in the text: a- the distance from the upper edge of the thyroid cartilage (the location of the pulse receiver on the carotid artery) to the jugular notch, where the upper edge of the aortic arch is projected; b- the distance from the jugular notch to the middle of the line connecting both spina iliaca anterior (the projection of the division of the aorta into the iliac arteries, which, with normal sizes and the correct shape of the abdomen, exactly coincides with the navel); With- distance from the navel to the location of the pulse receiver on the femoral artery.The resulting dimensions b and c are added up and the distance a is subtracted from their sum: b + c-a \u003d LE.
The subtraction of the distance a is necessary due to the fact that the pulse wave in the carotid artery propagates in the opposite direction to the aorta. The error in determining the length of the segment of elastic vessels does not exceed 2.5-5.5 cm and is considered insignificant. To determine the path length during the propagation of a pulse wave through the vessels of the muscular type (LM), it is necessary to measure the following distances (see Fig. 11): - from the middle of the jugular notch to the anterior surface of the humeral head (61); - from the head of the humerus to the place of application pulse receiver on the radial artery (a. radialis) - c1. More accurately, this distance is measured with the arm retracted at a right angle - from the middle of the jugular notch to the location of the pulse sensor on the radial artery– d(b1+c1)(see Fig. 11). As in the first case, it is necessary to subtract the segment a from this distance. From here: b1 + c1 - a - Li, but b + c1 = d
or d - a = LM

Fig.12.
Designations:
a- curve of the femoral artery;
b- carotid curve;
in- radial artery curve;
te- lag time in elastic arteries;
tm is the delay time along the muscular arteries;
i- incisura The second value that you need to know to determine the speed of propagation of a pulse wave is the delay time of the pulse on the distal segment of the artery in relation to the central pulse (Fig. 12). The lag time (r) is usually determined by the distance between the beginnings of the rise of the curves of the central and peripheral pulses or by the distance between the bending points on the ascending part of the sphygmograms. arteries (a. femoralis) - the delay time of the propagation of the pulse wave through the elastic arteries (te) - the delay time from the beginning of the rise of the curve a. carotis before the start of the rise of the sphygmogram from the radial artery (a. radialis) - the delay time in the vessels of the muscular type (tM). Registration of a sphygmogram to determine the delay time should be carried out at a speed of photographic paper of 100 mm / s. For greater accuracy in calculating the delay time of a pulse wave, 3-5 pulse oscillations are recorded and the average value is taken from the values \u200b\u200bobtained during the measurement (t) To calculate the speed of propagation of the pulse wave (C) it is now necessary to divide the path (L) traveled by the pulse wave (distance between pulse receivers) by the pulse delay time (t) C=L(cm)/t(s).
So, for the arteries of the elastic type: SE=LE/TE,
for muscular arteries: CM=LM/tM.
For example, the distance between the pulse sensors is 40 cm, and the delay time is 0.05 s, then the speed of the pulse wave:
C=40/0.05=800 cm/s
Normally, in healthy individuals, the speed of propagation of a pulse wave through elastic vessels ranges from 500-700 cm / s, through vessels of the muscular type - 500-800 cm / s. Elastic resistance and, therefore, the speed of propagation of a pulse wave depend primarily on individual characteristics , the morphological structure of the arteries and the age of the subjects. Many authors note that the velocity of the pulse wave increases with age, and somewhat more in the vessels of the elastic type than in the muscular ones. This direction of age-related changes may depend on a decrease in the extensibility of the walls of muscular vessels, which to some extent can be compensated by a change in the functional state of its muscular elements. So, N.N. According to Ludwig (Ludwig, 1936), Savitsky cites the following norms of pulse wave propagation velocity depending on age (see table). Age norms of the speed of propagation of the pulse wave through the vessels of the elastic (Se) and muscular (Sm) types:
Age, years |
Se, m/s | Age, years | Se, m/s |
| 14-30 | 5,7 | 14-20 | 6,1 |
| 31-50 | 6,6 | 21-30 | 6,8 |
| 51-70 | 8,5 | 31-40 | 7,1 |
| 71 and older | 9,8 | 41-50 | 7,4 |
| 51 and older | 9,3 |
When comparing the average values of Se and Sm obtained by V.P. Nikitin (1959) and K.A. Morozov (1960), with the data of Ludwig (Ludwig, 1936), it should be noted that they coincide rather closely.
Especially increases the speed of propagation of the pulse wave through the elastic vessels with the development of atherosclerosis, as evidenced by a number of anatomically traced cases (Ludwig, 1936).
E.B. Babsky and V.L. Karpman proposed formulas for determining the individually due values of the pulse wave propagation velocity depending on or taking into account age:
Se \u003d 0.1 * B2 + 4B + 380;
CM = 8*B + 425.
In these equations there is one variable B-age, the coefficients are empirical constants. The appendix (Table 1) shows individually due values calculated according to these formulas for the age from 16 to 75 years. The speed of propagation of the pulse wave through the elastic vessels also depends on the level of the average dynamic pressure. With an increase in the average pressure, the speed of propagation of the pulse wave increases, characterizing the increase in the "tension" of the vessel due to its passive stretching from the inside by high blood pressure. When studying the elastic state of large vessels, it is constantly necessary to determine not only the speed of propagation of the pulse wave, but also the level of average pressure.
The discrepancy between changes in mean pressure and the velocity of the pulse wave is to a certain extent associated with changes in the tonic contraction of the smooth muscles of the arteries. This discrepancy is observed when studying the functional state of the arteries, predominantly of the muscular type. The tonic tension of the muscle elements in these vessels changes quite quickly.
To identify the "active factor" of the muscle tone of the vascular wall, V.P. Nikitin proposed a definition of the relationship between the speed of propagation of a pulse wave through the vessels of the muscular (Sm) and the speed through the vessels of the elastic (Se) types. Normally, this ratio (CM / C9) ranges from 1.11 to 1.32. With an increase in the tone of smooth muscles, it increases to 1.40-2.4; when lowered, it decreases to 0.9-0.5. A decrease in SM/SE is observed in atherosclerosis, due to an increase in the speed of propagation of the pulse wave through the elastic arteries. In hypertension, these values, depending on the stage, are different.
Thus, with an increase in the elastic resistance, the rate of transmission of pulse oscillations increases and sometimes reaches large values. A high speed of pulse wave propagation is an unconditional sign of an increase in the elastic resistance of the arterial walls and a decrease in their extensibility.
The speed of propagation of the pulse wave increases with organic damage to the arteries (an increase in SE in atherosclerosis, syphilitic mesoaortitis) or with an increase in the elastic resistance of the arteries due to an increase in the tone of their smooth muscles, stretching of the walls of the vessel by high blood pressure (an increase in CM in hypertension, neurocirculatory dystonia of a hypertensive type) . With neurocirculatory dystonia of the hypotonic type, a decrease in the velocity of propagation of a pulse wave through the elastic arteries is mainly associated with a low level of mean dynamic pressure.
On the resulting polyphygmogram, the curve of the central pulse (a. carotis) also determines the time of exile (5) - the distance from the beginning of the rise in the pulse curve of the carotid artery to the beginning of the fall of its main systolic part.
N.N. Savitsky for a more correct determination of the time of exile recommends using the following technique (Fig. 13). We draw a tangent line through the heel of the incisura a. carotis up the catacrota, from the point of its separation from the catacrota of the curve we lower the perpendicular. The distance from the beginning of the rise of the pulse curve to this perpendicular will be the time of exile. 
Fig.13.
We draw the line AB, coinciding with the descending knee of the catacrosis. At the place where it departs from the catacrosis, we draw the line SD, parallel to the zero one. From the point of intersection we lower the perpendicular to the zero line. The ejection time is determined by the distance from the beginning of the rise of the pulse curve to the intersection of the perpendicular with the zero line. The dotted line shows the determination of the time of exile at the location of the incisura. 
Fig.14.
The time of complete involution of the heart (duration of the cardiac cycle) T is determined by the distance from the beginning of the rise of the curve of the central pulse (a. carotis) of one cardiac cycle to the beginning of the rise of the curve of the next cycle, i.e. the distance between the ascending knees of two pulse waves (Fig. 14).
Size: px
Start impression from page:
transcript
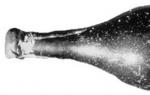
1 Pulse wave Mathematical model for calculating the speed of the pulse wave When the heart contracts, the wave of deformation and thickening of its walls propagating along the artery is called the pulse wave, it is easily felt on the radial artery of the arm. Its speed lies in the range from 5 to 10 meters per second or more, which is 10 times higher than the average speed of blood through the blood vessels. It turned out that the speed of propagation of the pulse wave depends on the elasticity of the arterial wall and therefore can serve as an indicator of its condition in various diseases. An artery with an inner diameter d is a sufficiently long (to neglect end effects) cylinder with walls of thickness h, made of a material with Young's modulus E. Let us construct a simplified mathematical model for the emergence of a pulse wave, and also determine its main parameter, the longitudinal propagation velocity v . Let us replace the bell-shaped waveform shown in the figure with a rectangular one and introduce the following designations: D is the diameter of the vessel thickening; d inner diameter of the vessel; h loan wall thickness; P1 pressure in the initial section; P2 pressure at the end of the thickened section; L is the length of the thickened part of the vessel; F, F - effort; ρ specific gravity of blood; S 0, S d, S i - area (outer, inner and rings). Deformation of the vessel wall during the onset of a pulse
2 A - A d F1, F1 D P1 P2 d h L Scheme and symbols of parameters during vessel deformation The force that occurs when blood is pumped into the vessel, where: S 0 = = = /. Since, then S 0 =. Hence, On the other hand, since the pulse wave is the movement of the vessel wall due to the force that arises in the longitudinal direction as a result of the pressure of the excess mass of blood entering the vessel with each contraction of the heart, then, in accordance with Newton's second law, we have:, where: m excess (systolic) blood mass, acceleration = v/t, ρ blood density, v velocity v = L/t, Q is the volume of excess blood mass. v/t = v 2, since F = F, hence, v 2 = ((P1 P2) / ρ) ((d /4 d) + 1) or finally v = / /. (1) This expression, obtained by us from the laws of kinematics and the dynamics of blood flow through the vessel, includes the relative deformation of the vessel walls d/d
3 and an increase in blood pressure in it (P1-P2). Obviously, the ratio of these two quantities can be found using Hooke's law, which, as is known, relates the magnitude of the relative deformation of the material with the force that causes this deformation, namely L/L = F /(S i E) We substitute the previously found values of F and S i and we get L/L = / (E) = =ρ v 2 / E, it is assumed that L/L= R/R=h/d, then we finally get v= /. (2) Equation 2 is the basic equation for the velocity of a pulse wave in the circulatory system, and it is considered, for almost any vessel, that the ratio h/d 0.1, i.e. pulse wave velocity v practically depends only on Young's modulus E. Anisotropy of blood vessels It is necessary to distinguish Young's modulus for E pr longitudinal and transverse E pop deformation of blood vessels. Based on physiological expediency, the vessels in the transverse direction should be less rigid than in the longitudinal direction, i.e. vessels must also play the role of a frame that can withstand additional stress on the muscle tissue of the body, and also ensure the constancy of the geometric dimensions and shape of individual organs. In this case, we calculated E = E pr It is known that E for arterial vessels correspond to 0.5 MPa. Substituting h/d=0.1, E= 0.5 MPa and ρ=1000 kg/m3 into expression (2) gives a value of v 7 meters per second, which is close to the experimentally obtained average value of the pulse wave propagation velocity. Anatomical studies show that the value of h/d varies little from person to person and practically does not depend on the type of artery. Therefore, taking into account the constancy of h/d, we can assume that the speed of the pulse wave changes only when the elasticity of the artery wall, its Young's modulus in the longitudinal direction changes. Let's compare the values of E pop and E pr. Let's calculate the value k= Р/(v 2 ρ) for ρ=1050kg/m 3 To do this, we will determine the value P using a tonometer and using the Pulstream+ device the values E pr and v.
4 Tonometer readings: systolic pressure 135 mmHg, diastolic pressure 79 mmHg, P= 56 mmHg. To determine the values of E pr and v on the basis of the Pulstream + device, a software and hardware complex was developed that allows measuring the delay time of the pulse wave relative to the R-wave of the ECG. The results of measuring the speed of the pulse wave gave the value v = 6.154 m / s, from where E pr = 2989.72 mm Hg. = .76Pa. Conversion coefficient - 1 mm Hg. = 133Pa. From the results obtained, we define the anisotropy of the vessels as the ratio E pop =k E pr. P= 56 mm Hg. = 7436Pa. Hence, k = 7436/(37,) = 0.187, i.e., the stiffness of the vessels in the transverse direction is 5 times less than in the longitudinal direction. E pop \u003d 0.187 E pr \u003d 0.76 \u003d 74357.3 Pa. The measurements of E pop aortic vessels on an atomic force microscope gave a value close to With age, and in diseases accompanied by an increase in the Young's modulus of the arterial wall (hypertension, atherosclerosis), the propagation velocity of a pulse wave can increase by almost 2-4 times compared with the norm. A negative role is also played by an increase in the concentration of cholesterol in the blood and its deposition on the walls of blood vessels. This allows the measurement of pulse wave propagation velocity to be used in making a diagnosis. Pulse wave velocity measurement process The measuring complex consists of a two-channel Pulstream+ device, bracelet-type metal electrodes that are worn on the wrists and which, using a jack-type connector, are connected to the ECG channel of the device. The measurement procedure is reduced to fixing the electrodes on the wrists, placing the index finger of the left hand in the area of the photosensor and starting the measurement program.
5 In the process of measurement, 2 curves are displayed on the screen, one contains ECG R-wave markers, the second is a differential pulsogram. Next, the curves are processed in order to determine the delay time of the pulsogram relative to the ECG. In this case, the marking is displayed on the screen according to the maximum of the ECG marker and the moment of opening of the aortic valve on the pulsogram. In this way, the durations of the delay intervals are calculated. The results of time measurements are averaged and displayed on the screen. The speed of the pulse wave is defined as the ratio of the length of the arteries from the beginning of the aorta to the phalanx of the finger applied to the sensor to the delay time of the pulsogram. The values of the longitudinal Young coefficient and pulse wave velocity are calculated immediately at the first stage and displayed in the designated fields of the main form of the program. The measurement results are shown in the figure.
6 Pressure calculations Pressure in the chamber of the left ventricle Consider the mechanism of the contractile function of the heart, providing arterial blood flow due to the work of the left ventricle. Rice. 1. Fig. 2. First of all, we calculate the value of systolic pressure based on the following assumptions. Let us assume that systolic blood pressure is determined by the work of the left ventricle after the mitral valve closes and from the moment the aortic valve opens. Until the mitral valve closes, blood from the left atrium is pumped into the cavity of the left ventricle. In Figure 1, blood flows from the atrium into the ventricle, and in Figure 2, blood is expelled from the left ventricle through the aortic valve into the aorta. We will be interested in the entire cycle of extrusion of blood into the aorta from the moment the aortic valve opens. Let us denote the volume of blood in the left ventricle as Q, and the pressure in it as P, and the mass of blood as m. Let's define myocardial work as A=P Q, then P=A/Q. But the work, on the other hand, is equal to A=F L, where F is the expulsion force, and L is the way the blood portion moves, then P= F L/Q, but F=m a, where a=v/t, and v=l/ t. It should be noted that v is not the velocity of blood flow in the aorta. This is the rate of ejection of a portion of blood from the left ventricle, which creates systolic pressure. Let's imagine the chamber of the heart as a cylinder with a base area S of length L, then L=Q/S. As a result of substitution in P of the found expressions, we obtain P = (m v L)/(t Q) = =(m Q L)/(S t 2 Q) =
7 \u003d (m L) / (S t 2) \u003d (m Q) / (S t) 2. Finally,. This ratio is of practical value, since it allows you to determine the pressure through the parameters of the left ventricle of the heart. Let's analyze it in more detail. Let us define the dimension of pressure in the SI metric system. In this system, the formula for the dimension of pressure is - P, where L is the length, M is the mass, T is the time. Let us substitute these symbols into the expression P = P that we have obtained, which corresponds to the pressure formula in the SI system. The conclusion is that in the process of obtaining the pressure formula, physical quantities were used that correctly determine the pressure value. Analysis of the ratio also shows that the parameters in the denominator are included in the formula in the second degree - both the time and the area of the exit opening to the aorta. The aortic valve is located in this area. That is, insufficient throughput of the valve sharply increases the pressure in the chamber. This applies equally to the time of expulsion of blood from the chamber of the left ventricle. The indicators in the numerators mass and volume are the same, since the mass is numerically equal to the volume multiplied by the density of blood ρ, and it is practically equal to one. Thus, if S and t decrease, and Q increases by 25%, then the pressure will increase by almost 10 times! It should be noted that the systolic pressure calculated by us is the excess pressure in the aorta over the diastolic pressure, which is maintained due to vascular tension with the aortic valve closed. To determine the mass and stroke volume of blood, you can apply the modified Starr formula: Q = 90.97 + 0.54 (P sys -P dia) -0.57 P dia -0.61 V, where B is age. Stroke volume Q is calculated from blood pressure within the limits: P systolic mm Hg, P diastolic mm Hg, pulse value from 60 to 90 beats per minute. Calculations are carried out for persons of 3 age groups: 1. Women from years, men from years with a multiplication factor Q by 1.25 2. Women from years, men from years with a multiplication factor Q by 1.55 3. Women from 56 years , men from 61 years old with a multiplication factor Q of 1.70 Let's calculate the pressure for some selected parameters.
8 The expression we have obtained allows us to calculate the pressure value in the chosen system of physical quantities. In practice, pressure is measured in mm. mercury column (mm Hg). If you set the mass of blood in g, volume in ml, time in seconds and diameter in cm, then, taking into account the conversion coefficients of physical units of measurement, we obtain a formula for calculating pressure in mm Hg. P = 7.34 10 [mm Hg] Here the diameter of the vessel is included in the denominator of the formula to the fourth power! Calculate P for some values of m, d, t and Q, m=ρ Q, ρ=1. d [cm] t [sec] Q [ml] P[mmHg] L[cm] V[cm/sec] 2 0.3 74.3 1.6 132.1 1.2 297.2 It can be seen from the given data that when d decreases by a factor of 2, the pressure increases by a factor of 16. The joint use of the formula for calculating the pressure P and the Starr formula for determining Q makes it possible to find the d-diameter of the opening of the outlet of the blood flow of the left ventricle through the aortic valve. To calculate, we measure the blood pressure P sys and P dia with a tonometer, and use the Pulstream + device to determine the time of systole t. Tonometer readings: 130/70 mm Hg Stroke volume Q according to Starr: Q = 1.70 (90.97 + 0.61 71) = 67.8 ml. Systole time t: 0.35 sec. Substituting 11.34 10 parameter values into the calculation formula gives the aortic valve opening diameter d=1.6 cm, which corresponds to the average size for the ascending aorta (1.5 cm) of the heart.
9 Diastolic pressure When calculating diastolic pressure, we will use the laws of vessel deformation under the following assumptions. Diastolic pressure is the pressure in the aorta, which has the shape of a cylindrical tube of radius R and length L. From the moment the aortic valve opens during systole, a portion of blood equal to the stroke volume Q and mass m is thrown into the aorta. This slightly increases the pressure inside the aorta and its radius. An increase in pressure causes an outflow of blood into the venous system of the body, i.e. at the same time, there is also a slight decrease in the volume and pressure of blood in the aorta. An analysis of the kinetic equation of blood motion allows us to conclude that the mass of the outflowing fluid is proportional to the pressure. This means that for a time equal to the duration of the cardiointerval, the volume of blood in the arterial system will decrease by the value, where is the total peripheral vascular resistance, P is the current pressure value, T is the duration of the cardiointerval. Peripheral resistance µ \u003d P cf / Q t has the same meaning as the resistance to electric current in Ohm's law. Let us determine the value at the following normalized values: the average pressure in the aorta Pav = Pdia +0.33 (Psys -Pdia) = = 80-0.33(120-80) = 93.3 mm Hg; stroke volume Q = 70 ml. Qt = Q/T. With a pulse of 76 beats / min, the duration of the cardio interval T = 60/76 = 0.79 sec. Hence Q t = 70/0.79 = 88.6 ml/sec, and µ = 93.3/88.6 = 1.053 mm Hg sec/ml. The recursive equation for the increase in blood volume with each stroke can be written as Q i+1 = Q i + Q P i T/µ
10 If the walls of the vessel are elastic and the deformation of the walls is subject to Hooke's law, then R / R = P / E or P = E (R / R) R increment of the radius, P pressure, E Young's modulus for the vessel wall, R the radius of the aorta, Consider a simplified scheme for pumping blood into the aorta 2(R+ R) Q L L vessel length S cross-sectional area of the aorta Find the radius increment through the volume increment Q = Q 0 + Q Q stroke volume S = Q/L, S = π R 2 / = / R = / R = R R 0 R/R = R/R 0 1 R/R = / i+1 = Q i + Q E Q i+1 = Q i + Q E R i = E T/µ T/µ,
11 Row 1
12 Row Differential pulsogram t1 - Phase (time) of intense contraction of FIS; t2 - Phase (time) of extreme load FEN; t3 - Phase (time) of reducing the load of the FSN; t4 - Phase (time) of the completion of the FZS systole.
13 The figure shows two pulsograms: upper normal, lower differential. It can be seen that the differential pulsogram contains much more extreme points. This allows using phase analysis methods to obtain reliable information about the hemodynamics of vascular blood flow. Even more valuable information about the state of the vascular wall can be obtained from the second derivative of pressure with respect to time. It should be noted that the differentiation process is always accompanied by a significant increase in the noise level, deterioration of the signal-to-noise ratio and complicates the process of obtaining reliable measurement results. The problem is aggravated by the fact that for reliable registration of even a conventional pulsogram, it is necessary to have devices with a gain of more than 1000 (60 dB). At the same time, the sensitivity at the input, with a signal-to-noise ratio of 1: 1, is not less than 1 millivolt. To isolate a differentiated signal (by the first derivative), the gain of the electronic device must be increased to 10000, which is very problematic, since the electronic device can usually switch to self-generation mode at such gains. It is practically impossible to obtain a reliable signal from the second derivative. Fundamentally new solutions had to be found. These solutions were found within the framework of the developed Pulstream technology. There are several ways to improve the signal-to-noise ratio. This is the creation of specialized electronic and software systems. Software filters. After amplification and digital conversion, the signal from each channel of the “Pulstream +” device enters the computer through the USB port and is further filtered by the moving average method to suppress noise. Moving average is a time series smoothing method in digital signal processing to eliminate high frequency components and noise, i.e. it can be used as a low pass filter. Moreover, the filtering of the signal is carried out without distortion of the phase characteristics of the signal. Let there be a digitized signal S(n), where n is the report number in the signal sample. Applying the moving average method, we get the signal F(n). The general formula for calculating the moving average is: F(k) =, (1) where W is the width of the averaging area, p i are weight coefficients. The essence of the method is to replace the sample point with the average value of neighboring points in a given neighborhood. In general, for averaging
14 weight coefficients are used, which in our case are accepted p i =1. The moving average calculation algorithm can be optimized in terms of the number of operations, and hence in execution time, by reducing the addition operations. To do this, you can use the fact that the summation over W reports can be done only once to find the element F(k)= SUM(k)/W, (2) / where SUM(k) = / ; (3) Then the next element can be calculated by the formula F(k+1) = (SUM(k) + S(k+ W/2 + 1) S(k- W/2)) / W (4) Computational costs for signal processing by the simple moving average algorithm is Nh + 2 (Ns-1) addition operations; Thus, at the first iteration of the algorithm, it is necessary to carry out Nh addition operations, and at subsequent Ns-1 iterations, only two addition operations each. Nh - window width (number of filter samples). Ns is the number of samples in the input signal. To eliminate distortions associated with the transients of the electronic components of the system, the processing starts with a delay of 100 read cycles from the input buffer. For one cycle of accessing the buffer, 5 samples for each channel are transferred to processing. Taking into account the specifics of reading information in the form of a packet of 5 samples, blocks were built into the filtering algorithm that allow repeating the smoothing procedure many times. Due to this, the reference value for each measurement point was increased many times over. For example, when the smoothing procedure was repeated three times, the signal value increased to tens of thousands. This made it possible to reliably differentiate the signal and obtain a 3rd order derivative. It follows from the above that the moving average method has the following positive qualities: - simplicity of algorithmization; - low computational costs; - large reduced gain; - absence of phase distortions of the signal.
15 Classical method of pulse wave velocity measurement The recording technique is quite simple: a sensor is applied to the place of pulsation of a vessel, for example, the radial artery, which is used as a piezocrystalline, tensometric or capacitive sensors, the signal from which goes to a recording device (for example, an electrocardiograph). With sphygmography, oscillations of the arterial wall caused by the passage of a pulse wave through the vessel are directly recorded. To register the speed of propagation of the pulse wave through the arteries of the elastic type, synchronous registration of the pulse is carried out on the carotid artery and on the femoral artery (in the groin area). Based on the difference between the beginnings of sphygmograms (time) and on the basis of measurements of the length of the vessels, the propagation velocity is calculated. Normally, it is equal to 4 8 m / s. To register the speed of propagation of the pulse through the arteries of the muscular type, the pulse is recorded synchronously on the carotid artery and on the radial one. The calculation is the same. The speed, normally from 6 to 12 m/s, is much higher than for the arteries of the elastic type. In reality, with the help of a mechanocardiograph, the pulse on the carotid, femoral, and radial arteries is simultaneously recorded and both indicators are calculated. These data are important for the diagnosis of pathologies of the vascular wall and for evaluating the effectiveness of the treatment of this pathology. For example, with sclerosis of blood vessels, the speed of the pulse wave increases due to the increase in the rigidity of the vascular wall. When engaging in physical culture, the intensity of sclerosis decreases, and this is reflected in a decrease in the speed of propagation of the pulse wave. Age-related values of the speed of propagation of the pulse wave through the vessels of the elastic (Se) and muscular (Sm) types, obtained with the help of piezoelectric sensors installed on the body in various zones of occurrence of large vessels. Age Se, m/s Age Cm, m/s,1 71 and over 9.4 51 and over 9.3 Measurement of pulse wave velocity using the Pulstream+ device
16 The “Pulstream+” device, due to the presence of 2 channels and a fairly good time resolution (about 2.5 ms), can be successfully used to record the speed of a pulse wave. For these purposes, special software has been developed that determines the time delay of the pulsogram relative to the R-wave of the electrocardiogram. The pulsogram and the I assignment of an ECG are synchronously registered. The L-path traveled by the pulse wave is taken as the base of the arm length plus the distance from the heart to the shoulder joint. It is approximately 1 meter. The time shift is defined as S=S1+S2 Sphygnogram Sphygmography is a non-invasive mechanocardiographic method aimed at studying arterial wall fluctuations caused by the release of stroke volume into the arterial bed. With each contraction of the heart, the pressure in the arteries increases and their cross section increases, then the initial state is restored. This whole cycle of transformations was called the arterial pulse, and its recording in the dynamics of the sphygmogram. There are sphygmograms of the central pulse (recording is made on large arteries close to the heart: subclavian, carotid) and peripheral (registration is carried out from smaller arterial vessels).
17 In recent years, piezoelectric sensors have been used to record sphygmograms, which makes it possible not only to accurately reproduce the pulse curve, but also to measure the speed of propagation of the pulse wave. The sphygmogram has certain identification points and, when recorded synchronously with ECG and FCG, allows you to analyze the phases of the cardiac cycle separately for the right and left ventricles. Technically, it is not difficult to record a sphygmogram. Usually, 2 or more piezoelectric sensors are simultaneously applied or synchronous recording is made with electro- and phonocardiograms. In the first case, the study is aimed at determining the speed of propagation of the pulse wave through the vessels of the elastic and muscular types (sensors are applied over the region of the carotid, femoral and radial arteries). To obtain curves suitable for interpretation, the sensors should be placed on the anterior cervical sulcus at the level of the upper edge of the thyroid cartilage (carotid artery), in the middle of the pupart ligament (femoral artery) and in the zone of maximum pulsation of the radial artery. For synchronous recording of a sphygmogram, electrocardiogram and phonocardiogram, see the section "Polycardiography". A sphygmogram is recorded at a tape drive speed of mm/s. The morphology of curves recorded from large and peripheral vessels is not the same. The curve of the carotid artery has a more complex structure. It begins with a small wave "a" (presystolic wave), followed by a steep rise (anacrota "a b"), corresponding to the period of rapid expulsion of blood from the left ventricle into the aorta (the delay between the opening of the aortic valves and the appearance of a pulse on the carotid artery is approximately 0 .02 s), then small oscillations are visible on some curves. In the future, the curve drops sharply downwards (a dicrotic wave "in d"). This part of the curve reflects the period of slow blood flow into the vascular bed (under less pressure). At the end of this part of the curve, corresponding to the end of systole, a notch (incisura "d") is clearly recorded, the end of the ejection phase. It can measure the short rise caused by the slamming of the semilunar valves of the aorta, which
18 corresponds to the moment of equalization of pressure in the aorta and ventricle (according to N. N. Savitsky), it clearly coincides with tone II of the synchronously recorded phonocardiogram. Then the curve gradually falls (gentle descent), on the descent, in most cases, a slight elevation (“e”) is visible. This part of the curve reflects the diastolic period of cardiac activity. The morphology of the peripheral pulse curve is less complex. It distinguishes 2 knees: ascending anacrota "a" (due to a sudden rise in pressure in the artery under study) with an additional dicrotic wave "b" (the origin of which is not entirely clear) and descending (see figure). Analysis of the sphygmogram of the central pulse can be aimed at studying the temporal characteristics of the cardiac cycle. E. B. Babsky and V. L. Karpman proposed the following equations for calculating systole and diastole: S = 0.324 C; S=0.183 C+0.142 where S is the duration of systole, C is the cardiac cycle. As you know, these indicators correlate with heart rate. If, at a given heart rate, an elongation of systole by 0.02 s or more is recorded, then we can state the presence of an increased diastolic volume (increased venous blood flow to the heart or congestion in the heart in the compensation stage). A shortening of the systole indicates myocardial damage (dystrophy, etc.). According to the morphology of the curve, one can get an idea about the features of the expulsion of blood from the left ventricle in various pathological conditions. A steep rise in the curve (more than normal) with an upward plateau is characteristic of increased pressure in the aorta and peripheral vessels, and an early peak with a low systolic top, turning into a rapid decline with a deep incisura, corresponds to low pressure in the aorta. Quite typical curves are recorded in aortic valve insufficiency (high initial amplitude and rapid diastolic fall), in aortic stenosis (low curve amplitude with a short initial rise and pronounced anacrotic incisura), etc. Synchronous recording of sphygmograms of the carotid, femoral and radial arteries (see. figure) allows you to determine the speed of propagation of the pulse wave. To calculate the “pulse lag time”, linear measurements of the following distances are made: l1 between the points of the pulse sensor location on the carotid artery and the jugular notch of the sternum, l2 from the jugular notch of the sternum to the navel; l3 from the navel to the place where the pulse sensor is placed on the femoral artery, l4 from the jugular notch of the sternum to the place where the sensor is fixed on the radial artery with the arm extended at a right angle to the body. Definition of time
19 delays in the start of the ascent. The recorded sphygmograms underlie the analysis of the velocity of propagation of the pulse wave. When determining the difference in the time of appearance of the curves of the carotid and femoral arteries, the speed of propagation of the pulse wave through the vessels of the elastic type (Сe) is calculated: Сe = l2+l3 l1/te where te is the delay time of the pulse wave from the carotid to the femoral arteries. The calculation of the speed of propagation of the pulse wave through the vessels of the muscular type is carried out according to the formula: CM \u003d l2 + l3 l1 / tm where 1m is the delay time of the pulse wave from the carotid to the radial arteries. The data are calculated in 5 10 complexes and the average values are displayed in cm/s. The ratio of the velocity of propagation of a pulse wave through the vessels of the muscular type to the velocity of propagation of a pulse wave through the vessels of the elastic type in healthy people is in the range of 1.1 1.3. The propagation velocity of the pulse wave is determined by the elastic properties of the arterial wall and varies with age from 400 cm/s in children to 1000 cm/s in people over 65 years of age (Table 1).
20 Description of PULSTRIM+ General information The PULSTRIM+ product is a continuation of the development of a number of devices developed using DOCTOR MOUSE technology. Operating experience of the previous PULSTRIM model showed the high efficiency of this device for domestic use. Over time, there was a need, both to improve its performance, and to expand the functions of the device. These are: - possibility of simultaneous registration of pulsogram and ECG; - the ability to determine the speed of the pulse wave; - increasing the sensitivity and noise immunity of the device; - the ability to work offline without connecting to a PC; - Possibility of direct connection to a cell phone; - the possibility of sending SMS messages to the doctor; - the possibility of transferring pulsograms and ECG to a medical server. At the same time, it was necessary to preserve the weight and dimensional characteristics of the device, as well as ensure the continuity of the existing user interface and preserve the structure of the existing database. All of the above requirements were implemented in the PULSTRIM+ device. Simultaneous registration is achieved by introducing a second independent channel, with the time resolution of each channel being 5 ms. The attenuation in the adjacent channel is not worse than 70 dB. An increase in the sensitivity threshold is achieved by using the stochastic resonance method. The sensitivity of the channels is 2.5 μV, with a signal-to-noise ratio of 1:1. Additional digital filters have been developed to improve noise immunity. The speed of the pulse wave is determined with the simultaneous registration of the pulsogram and ECG and allows you to assess the state of the vascular wall. This parameter also evaluates the dynamics of changes in blood pressure. To ensure operation with a connection to a cell phone, a user interface was developed, based on a SMARTPHONE such as HTC, to a large extent identical to that developed for a PC.
21 PDA software is designed to work under Windows Mobile ver OS PULSTRIM device is connected to a SMARTPHONE via USB. The software on a PC is designed to work under Windows XP, Windows 7. The appearance of the device is shown in Figure 1. The device has dimensions of 135 X 70 X 20 mm and weighs about 150 g. panel with control buttons, display and optical sensor zone. On the left, on the side, there is a mini USB connector and a connector for connecting ECG electrodes. On the back of the case there is a compartment for battery power. Inside the case is a board with electronic components. Battery power is used for standalone operation and when connecting a smartphone. When connected to a personal computer, power is supplied from the USB port. Rice. 1 In offline mode, you can check the device and take a heart rate monitor.
22 When the device is connected to a smartphone or PC, the communication status of the connected device is displayed. Software for PC and smartphone can be downloaded from this site. Description of the ECG recording and processing mode The appearance of the PULSTREAM+ splash screen (main window) is not much different from the PULSTREAM window, with the exception of a group of two “signal” radio buttons located in the lower left corner of the screen saver, which set the PULSE GRAM input mode ( PUL) or ECG (Fig. 2). The purpose of the remaining control buttons and their appearance are the same, both for the PUL mode and for the ECG. Rice. 2 After installing the measuring electrodes on the patient's body, you can begin the process of taking an ECG. To do this, it is advisable to switch to manual mode and press the "Measure" button. During the measurement, body and hand movements are not allowed. Measurements can be made using standard electrodes. Hand electrodes have also been developed based on electrodes used to remove electrostatic potential from hands during assembly work with electronic products. As in the case of pulsogram registration, the differential ECG curve is displayed on the screen, the processing of which allows you to identify and remove interference and noise from the signal. The problem of obtaining a "clean" undistorted signal during development was given great attention. Modern interference suppression techniques were used while maintaining high sensitivity. The absence of interference makes it possible to calculate the temporal characteristics of the work of the heart and blood vessels with high accuracy and significantly improves the diagnostic capabilities of the device.
23 The differential curve is much more informative and allows you to more accurately identify abnormalities in the work of the heart muscle. After the registration process is completed, it is necessary to activate the "Check" button. The labeled ECG curve converted to the integral form will appear on the screen. Currently, this type of ECG is used for diagnostic purposes in cardiology. Below are the drawings of the differential (Fig. 3) and integral (Fig. 4) ECG. Rice. 3 Fig. 4 After visual analysis of the ECG, press the "Calculate" button to display the results (Fig. 5). The calculated variational parameters of the rhythm are fully consistent with the results of the calculation in the analysis of the rhythm for the PULSE GRAM.
24 Fig. 5 The results of the analysis of the ECG form are reduced to the automatic determination of the duration of the QRS interval and the graphical output of one fragment of the ECG. In cardiology, in accordance with accepted standards, the amplitudes and intervals of pre-marked pqrst teeth are measured (Fig. 6). Rice. 6 There is a wide variety of ECG forms and in many cases it is almost impossible to automatically analyze them. Therefore, the method of semi-automatic manual determination of the durations of the selected intervals was applied. To do this, on the curve (Fig. 7) using the mouse cursor, the starting point is selected by pressing the left button, and then the cursor is moved to the end point and by clicking again, the calculated value in ms automatically appears in the window (Fig. 8). In this case, the measured value of the pq-interval corresponds to 180 ms. There are normalized values of these indicators that determine the state of the heart muscle and the conduction system of the heart.
25 Fig. 7 Fig. 8 After clicking on the “Conclusion” button, a brief conclusion appears (Fig. 9), which is based on the analysis of the values of the rhythm parameters of the registered ECG. Rice. 9 To save the obtained results after receiving the conclusion, you need the “File” menu and select the “Register” mode, the window will open. 10. Then you need to fill in (correct) the proposed fields and click the "Save" button. It is necessary to observe the following condition for entering information in the "PATIENT" field: the first symbol of the pulsogram is "#", electrocardiograms
26 Fig. 10 The menu modes "File", "Service" and "Help" work out identically to the mode of processing a pulsogram. Electrodes for ECG recording Several types of measuring electrodes are used and developed: standard for chest lead, manual ones in the form of metal bracelets, manual ones with Velcro fixation, manual ones with adjustable tension with a rubber band. For long-term and permanent wear, the most effective is the use of metal bracelets, which have a large contact area and do not require the application of an electrically conductive gel. To take an ECG in children, it is advisable to use manual electrodes with adjustable tension with a rubber band or with Velcro fixation. Figures 11 and 12 show the electrodes used. Rice. 11 Recording pulsograms with a video camera
27 A video camera is an electron-optical device that allows recording various opaque objects in reflected light. The image of an object is projected onto a photosensitive matrix with the help of an objective lens, the signal from which is sent to a personal computer via a USB channel. Next, the video signal is processed programmatically and the image is displayed on the computer monitor. Camera resolution is determined by the number of dots (pixels) per unit area of the photosensitive matrix of the video camera. The more pixels, the higher the resolution. For our purposes, this parameter is not decisive. Moreover, the lower it is, the better, the noise immunity improves. More significant are the sensitivity indicators in the spectral range. The spectral range of visible light is from 400 to 700 nm. We will be interested in the region of the red and near infrared region (more than 700 nm). Almost all cameras in this range have a fairly high sensitivity, i.e. suitable for use as a pulse wave sensor. Let us dwell in more detail on the issues of registering the pulse using a camera. Preliminary explanations. If in a dark room we close a bright light source with the palm of our hand, then we will see a red relief of the outlines of the fingers, i.e. hand tissue is a filter that transmits red light. Since the entire tissue is permeated with a network of blood vessels, which, in time with the contraction of the heart, change their blood supply, resulting in a change in the intensity (modulation) of the transmitted light. We get the same picture when using a video camera. If you close the lens with your finger and direct a light source at it, then when the camera is turned on, an unevenly glowing red square will appear on the monitor screen, on which slight fluctuations in the brightness of individual areas are visible. This is the pulsation of blood in the phalanx of the finger. Let us return to the question of registering the pulsations of the brightness of the light flux in the chamber. The luminance of a pixel is determined by the three chroma values of red, blue, and green. Their values can be obtained programmatically. It should be immediately noted that the registration of brightness pulsations is carried out at the level of large interference and noise. Next, a section of the image is selected, for example, 10x10 pixels, and the total brightness index is calculated for each frame of the video recording. In this case, the signal is filtered and smoothed. If the recording is made with the registration of the brightness of each frame, then at the output we will get a pulsogram.
28 This is the essence of the method on the basis of which the software of the VIDEOPULS system has been developed. Pulse wave simulator To obtain a stable optical signal simulating a pulse wave under given physiological parameters, a pulse wave simulator was developed and manufactured. The pulse wave simulator in its composition consists of a PC, to which an optical head is connected via a serial port, consisting of controlled color emitters, and software. The software control of emitters allows, due to variations in the sequence of switching on and changing the duration of ignition and extinguishing of individual multi-colored sources, to simulate the passage of a pulse wave with specified physiological parameters. The form of the model signal was chosen, which in its composition contains some deviations from the norm in the hemodynamics of capillary blood flow, namely, a “step” is observed in the area of extreme myocardial load, and a significant rise above the zero level is also visible during diastole. The table summarizes the results of processing the signals received at the input of the PULSTRIM+ device from the simulator at different times of the day. Nom Pulse beats/min Variation range (sec.) Coefficient of variation (%) Vascular tone % Max. load sec Res. vessels sec 1 71.7 0.005 0.279 0.0744 0.7 0.005 0.133 0.0731 0.7 0.005 0.061 0.0733 0.0434
29 4 71.7 0.005 0.075 0.0727 0.7 0.005 0.132 0.0734 0.7 0.005 0.177 0.0732 0.7 0.005 0.204 0.0742 0.0429 good reproducibility of results.
Description of PULSTRIM+ General information The PULSTRIM+ product is a continuation of the development of a number of devices developed using DOCTOR MOUSE technology. Five years of experience in operating the previous model PULSTRIM
5 Photoplethysmography Introduction The movement of blood in the vessels is due to the work of the heart. When the myocardium of the ventricles contracts, blood is pumped under pressure from the heart into the aorta and pulmonary artery. Rhythmic
MINISTRY OF HEALTH OF THE RUSSIAN FEDERATION AMUR STATE MEDICAL ACADEMY N.V. NIGEY
UDC 535.341.6 O.A. REMAEVA, Ph.D. tech. Sciences, E.V. REMAEV OPTICAL METHOD OF NON-INVASIVE DETERMINATION OF HUMAN BLOOD PRESSURE In the last decade, there has been an increased interest in developed countries
CURRENT CONTROL TESTS on the topic "METHODS OF RESEARCH OF THE CARDIOVASCULAR SYSTEM" Choose the number of the correct answer 1. Heart sounds are sound phenomena that occur a) during auscultation of the heart b) during
1. Hemodynamics of arterial vessels. The physical mechanism of transformation of pulsed ejection of blood by the ventricles of the heart into a continuous arterial blood flow. Poiseuille's equation, meaning. Laws of the system-wide
Current control tests on the topic “Methods for studying the cardiovascular system. Cardiac cycle» Select the number of the correct answer 1. For the first time, an accurate description of the mechanisms of blood circulation and the meaning of the heart
43 MECHANICAL PROPERTIES OF BIOLOGICAL TISSUES. PHYSICAL QUESTIONS OF HEMODYNAMICS Task 1. Choose the correct answer: 1. Deformation is called .... a) change in the relative position of bodies; b) change in mutual
The main condition for the fulfillment of its functions by blood is MOVEMENT During the day, blood is pumped 1.5-2 thousand times through the heart Cardiovascular system The circulatory system is closed. Two circles of blood circulation
Ministry of Education of the Omsk Region Omsk Technical School of the Meat and Dairy Industry Scientific and Practical Conference of Students “Physics of Medicine. Blood pressure” Performed by: Saydasheva
TESTS of the current control on the topic "LAWS OF HEMODYNAMICS" 1. Choose 3 correct answers. The main factors that determine the movement of blood through the vessels are a) the work of the heart b) the blood pressure gradient
LECTURE 4 FLUID MECHANICS, FUNDAMENTALS OF BIORHEOLOGY AND SOME ISSUES OF HEMODYNAMICS I. Ideal and real fluids II. Newtonian and non-Newtonian fluids III. The flow of a viscous fluid through pipes IV. Subject
BIOLOGY The movement of blood through the vessels class Lecturer: Kryukova Margarita Khrisanfovna Causes of the movement of blood through the vessels. Blood pressure is the pressure of blood on the walls of blood vessels. pressure difference
24 A.I. Dyadyk, L.S. Kholopov. Auscultation of the heart Systole I tone II tone Diastole I tone Figure 3. Heart sounds and periods of the cardiac cycle The period between I and II sounds corresponds to ventricular systole,
Chapter IV. Blood circulation Home: 20 Topic: Blood pressure in the vessels Tasks: To study the change in blood pressure and its regulation Pimenov A.V. 2006 Blood pressure In the human circulatory system, blood
UDC 62.791.2 Device for the study of arterial circulation by occlusion-oscillometric method Bykov AA, student Russia, 105005, Moscow, MSTU im. N.E. Bauman, Department of Medical and Technical
MMA them. THEM. Sechenova Department of Faculty Therapy 1 ELECTROCARDIOGRAPHY 1. Normal ECG Professor Podzolkov Valery Ivanovich Origin of ECG Currents generated by cardiomyocytes during depolarization
LABORATORY WORK STUDY OF ELECTRIC PROCESSES IN SIMPLE LINEAR CIRCUITS The purpose of the work: to study the transfer coefficient and phase shift between current and voltage in circuits consisting of series
Normal electrocardiogram In order to justify ourselves in our own eyes, we often convince ourselves that we are unable to achieve the goal, but in fact we are not powerless, but weak-willed. François de La Rochefoucauld. Gauge
LASER DOPPLER FLOWMETRY General view of the LAKK-02 analyzer version 1 1 analyzer unit, 2 base probe for microcirculation studies, 3 white PTFE disk for checking the zero reading
STUDY OF THE PHENOMENON OF INTERFERENCE: JUNG'S EXPERIENCE The purpose of the work is to study the phenomenon of light interference using the example of Young's experiment, to study the interference pattern obtained in Young's experiment, to study the dependence
Software for acoustic emission systems "RANIS". The software for RANIS acoustic emission systems was created to support all the features of the equipment and takes into account the long-term
Laboratory work 10 EXPERIMENTAL DETERMINATION OF THE ADIABATIC INDICATOR FOR AIR The purpose of the work is to study the basic relationships between thermodynamic parameters and quantities, processes occurring in an ideal
The purpose of the work LABORATORY WORK 9 A Study of the interference of electromagnetic waves study of the propagation of electromagnetic waves; study of the phenomenon of wave interference; experimental determination of length
Diagnostic value of defibrillation Electrical defibrillation in addition to therapeutic is of great diagnostic value. Issues of accurate diagnosis in mitral malformations, especially since it has become
Laboratory work 41 2 Determining the radius of curvature of the lens by the interference method The purpose of the work: to study interference in thin films on the example of Newton's rings and determine the radius of curvature of the lens.
St. Petersburg State University Faculty of Mathematics and Mechanics Department of Information and Analytical Systems Coursework Determining the pulse by ECG Alexander Chirkov Supervisor:
Municipal public institution gymnasium 64 Scientific and experimental biology Topic: "Cardiovascular system" Prepared by: Anastasia Kornacheva Student: 8th grade Supervisor: Fedorova E.V.
THE FINAL STAGE OF THE ACADEMIC COMPETITION OF THE SCHOOLCHILDREN'S OLYMPIAD "STEP INTO THE FUTURE" IN THE GENERAL SUBJECT "PHYSICS" YEAR 0 OPTION A small ball falls from a height = m without initial
The main provisions of the theory .... Preliminary preparation ... 5 3. Assignment for the experiment ... 8 4. Processing the results of experiments ... 3 5. Questions for self-examination and preparation for defense
State Higher Educational Institution "DONETSK NATIONAL TECHNICAL UNIVERSITY" Department of Physics REPORT on laboratory work 90 STUDY OF THE DEPENDENCE OF THE REFRACTIVE INDEX OF GASES ON PRESSURE
LABORATORY WORK 1 DETERMINATION OF THE RATIO OF THE HEAT CAPACITIES OF AIR AT CONSTANT PRESSURE AND VOLUME BY THE RESONANCE METHOD The purpose of the work: to study the process of propagation of a sound wave, measure the speed
Lecture 8 Wave motion Propagation of vibrations in a homogeneous elastic medium Longitudinal and transverse waves Equation of a plane harmonic traveling wave displacement, velocity and relative deformation
69 S.P. FOMIN Development of an electrocardiogram analysis module UDC 004.58 and N.G. Stoletovs, Murom
Introduction Circulatory diseases are the cause of more than 50% of deaths in the developed countries of the world and in particular in our country. It is believed that the main way to combat these diseases is the development
Laboratory work 35 Investigation of resonance in an alternating current circuit Methodical guide Moscow 04 Investigation of resonance in an alternating current circuit. Objective of the Lab Study of Addiction
Computer program Acoustic tomography - Leak detector (version 1.1.5) USER INSTRUCTION 1. General information. The program Acoustic tomography - leak detector (AT-T) is designed for processing records
Laboratory work 1.5 DETERMINATION OF THE VISCOSITY COEFFICIENT BY THE STOKES METHOD The purpose of the work: to determine the optimal experimental parameters for determining the viscosity of a liquid by the Stokes method. Formulation of the problem
CHANGES TO THE OPERATING MANUAL FOR THE BALCOM 1 DEVICE Appendix 2 1. Introduction
A unique phenomenon in the history of modern civilization is the creation of a new fundamental science of Cardiometry www.rosnou.ru www.cardiomery.ne www.cardiocode.ru The scientists of the Russian New University have made
Work 9 Determination of the moments of inertia of bodies by the method of rotational oscillations Purpose of the work: determination of the moment of inertia of the disk by the method of rotational oscillations and verification of the Huygens-Steiner theorem. Introduction Basic
Work .. Studying forced oscillations in an oscillatory circuit Purpose of work: studying the dependence of the current in an oscillating circuit on the frequency of the EMF source included in the circuit, and measuring the resonant frequency
DIGITAL ACCELEROMETER ZET 7151 OPERATING MANUAL ETMS.421425.001-151 RE ETMS LLC Table of contents 1 Purpose and technical characteristics... 3 1.1. Purpose of digital sensors... 3 1.2. Terms
FEDERAL STATE BUDGET EDUCATIONAL INSTITUTION OF HIGHER EDUCATION "AMUR STATE MEDICAL ACADEMY" OF THE MINISTRY OF HEALTH OF THE RUSSIAN FEDERATION NIGEI DIMENSION
Laboratory work Study of diffraction in a parallel beam of laser radiation. Purpose of the work: familiarization with the diffraction of light on a one-dimensional diffraction grating and determination of the wavelength of laser radiation;
1. General. Specifications 1.1. Power supply of the device either from accumulators, or from the connected network adapter. 1.1.1. AC adapter +V with a power of at least 4 W (load current of at least 8 mA).
Work.8 MEASURING THE AIR HIDIABATS BY THE RESONANT METHOD task. Measure the natural oscillation frequencies of the piston in the tube under the conditions when the restoring force is generated by: a) a magnetic field; b)
Laboratory work 1 Determination of the radius of curvature of the lens surface by the method of Newton's rings. Objective. The purpose of the work is to determine the radius of curvature of a convex spherical surface (one of the surfaces of a glass
FEDERAL AGENCY FOR EDUCATION State Educational Institution of Higher Professional Education "Pacific State University" STUDY OF FORCED OSCILLATIONS IN ELECTRIC
R.M.S. Joemai Leiden University Medical Centre, Leiden, The Netherlands MSCT scan: - automatic cardiac phase selection using the phasexact algorithm phasexact determines the optimal for
THE FINAL STAGE OF THE ACADEMIC COMPETITION OF THE OLYMPIAD FOR SCHOOLCHILDREN "STEP INTO THE FUTURE" ON THE GENERAL SUBJECT "PHYSICS" 05 YEAR OPTION 9 TASKS A Small ball falls from a height = m without initial
Purpose of work: LABORATORY WORK 9 MEASUREMENT OF YOUNG'S MODULUS BY THE METHOD OF STANDING WAVES IN A ROD 1. To study the conditions for the occurrence of a longitudinal standing wave in an elastic medium.
SIMULATION OF THE ELECTRIC HEART GENERATOR Calculation of parameters of the electrocardiogram of the ventricular complex
X A0 e βt cos (ω t α)
Laboratory work 20 Determination of the wavelengths of the lines of the radiation spectrum using a diffraction grating The purpose of the work: familiarization with a transparent diffraction grating; source spectrum wavelength determination
`LABORATORY WORK 3.0 DETERMINATION OF THE RADIUS OF CURVATURE OF A LENS WITH THE HELP OF NEWTON'S RINGS. The purpose of the work The purpose of this work is to study the phenomenon of light interference and the application of this phenomenon to measure
Laboratory work Determination of the capacitance of a capacitor from the oscillogram of its discharge through a resistor Methodological guide Moscow 04 Determination of the capacitance of a capacitor from its oscillogram
POWER MEASUREMENT PACKAGE PMA SOFTWARE MAIN FEATURES: Automatic setting and display of the waveform and its parameters. Signal scaling, display in units of measurement: Volt,
Department of Cardiology NMAPE Nosenko N.M. Hemodynamics is a branch of science that studies the mechanisms of blood movement in the cardiovascular system. It is part of the hydrodynamics branch of physics that studies the movement of fluids.
Option 1 1. The time interval from the beginning of one oscillation to its completion 1. Pulse duration 2. Period of oscillation 3. Reverberation time 4. Delay time 2. For what type of waves in one
Grade 10 Task 1 (10 points) The ball falls without initial speed from a height onto an inclined plane, the angle of inclination of which is
Laboratory work 2.2 STUDYING THE PHENOMENON OF INTERFERENCE: JUNG'S EXPERIENCE Purpose of work: studying the phenomenon of light interference using the example of Young's experiment, studying the interference pattern obtained in Young's experiment, research
Work 25а STUDY OF THE PHENOMENA DUE TO DIFFRACTION The purpose of the work: observation of the diffraction of light on a diffraction grating, determination of the period of the diffraction grating and the transmission region of light filters Equipment:
UDC 12.04.421.7(07) E.V. Strygina THE CHOICE OF HEMODYNAMIC INDICATORS FOR MONITORING THE CARDIOVASCULAR SYSTEM Adequate hemodynamics is an absolutely necessary condition for the normal functioning of internal organs.
According to the type of pulse wave, one can indirectly judge the elasticity of the walls of the arteries. There are three types of pulse waves: A, B and C. The formation of different forms of pulse waves occurs depending on the time interval between the two components of the pulse wave: direct and reflected wave. Normally, the first component of the pulse wave, the direct wave, is formed by the stroke volume of blood during systole, and is directed from the center to the periphery. In the places of branching of large arteries, the second component of the pulse wave is formed, the reflected wave, which propagates from the peripheral arteries to the heart. In young, healthy people without heart disease, the reflected wave reaches the heart at the end of cardiac contraction or at the beginning of the relaxation phase, which allows the heart to work easier and improves blood flow in the vessels of the heart (coronary vessels), since their blood supply occurs mainly during diastole. At the same time, a type of pulse wave curve C is formed, on which two peaks are clearly visible, the first corresponds to the maximum of the direct wave, the second, smaller one, to the maximum of the reflected wave. Below is an illustration of a type C pulse wave:
With an increase in the stiffness of the arteries, the speed of propagation of pulse waves through them increases, while the reflected waves return to the heart during early systole, which significantly increases the load on the heart, because each previous reflected wave "extinguishes" the next direct wave. In other words, the heart that pumps blood has to do additional work to resist the untimely arrival of the pulse wave, which is superimposed on the contraction. The time interval between the maxima of the direct and reflected waves decreases, which is graphically expressed in the formation of a curve of type A and B pulse waves. These types of pulse waves are typical for the elderly, as well as for patients with diseases of the cardiovascular system. Pulse wave types B and A are illustrated below.


It is important to note that in the formation of pulse waves of a certain type, a significant contribution is made not only by the systemic stiffness of large arteries, a value that is quite stable and hardly amenable to reverse development, but also by the tone of small arteries, which, on the contrary, is quite labile, and normally easily changes under the influence of various external factors. Therefore, when receiving results that do not correspond to age, first of all, make sure that the rules for conducting the study are observed. Focus not on the results of single random measurements, but on changes in indicators in dynamics, the most reliable is a series of results recorded over a long period of time. Try to take measurements at a certain time of the day and on the same hand, preferably a “working” one. The optimal time for the study is considered to be the morning hours, from 9 to 11.
Methods for controlling the blood filling of tissues
and pulse wave velocity measurements
The speed of propagation of the pulse wave in the aorta can be 4-6 m/s, in the arteries of the muscular type 8/12 m/s. The linear velocity of blood flow through the arteries usually does not exceed 0.5 m/sec.
Plethysmography(from the Greek plethysmos - filling, increase + graphō - write, depict) - a method for studying vascular tone and blood flow in small-caliber vessels, based on graphic registration of pulse and slower fluctuations in the volume of any part of the body associated with the dynamics of blood filling of vessels.
Method photoplethysmography based on the registration of the optical density of the studied tissue (organ).
Physical basis of blood flow(hemodynamics).
Volumetric blood flow velocity (Q) is the volume of fluid (V) flowing per unit time through the cross section of the vessel:
Q = V/ t (1)
The linear velocity of blood flow is determined by the ratio of the path traveled by blood particles to time:
υ = l/ t (2)
The volumetric and linear velocities are related by the relation:
Q = υ · S, (3)
where S is the cross-sectional area of the fluid flow.
For a continuous flow of an incompressible fluid, the continuity equation is satisfied: the same volumes of fluid flow through any section of the jet per unit time.
Q = υ · S = const (4)
In any section of the heart- vascular system, the volumetric blood flow velocity is the same.
The area of the total lumen of the capillaries is 700-800 times larger than the cross section of the aorta. Taking into account the continuity equation (4), this means that the linear velocity of blood flow in the capillary network is 700-800 times less than in the aorta, and is approximately 1 mm/ With. At rest, the average blood flow velocity in the aorta ranges from 0.5 m/ From to1 m/ With, and with heavy physical exertion can reach 20 m/ With.

Rice. 2. The relationship between the total cross section of the vascular system (S) at different levels (solid line) and the linear velocity of blood flow (V) in the corresponding vessels (dashed line):
Viscous friction force according to Newton's formula:
Ftr= - η · S·(dυ / dy), (5)
where η is the viscosity coefficient (dynamic viscosity), S is the contact area of the contacting layers. In whole blood, the viscosity measured on a viscometer is about 5 mPa s, which in5 times the viscosity of water. In pathological conditions, blood viscosity ranges from 1.7 mPa s to 22.9 mPa s.
Blood, together with other fluids whose viscosity depends on the velocity gradient, refers to non-Newtonian liquids. The viscosity of blood is not the same in wide and narrow vessels, and the effect of the diameter of the blood vessel on the viscosity begins to affect when the lumen is less than 1 mm.
Laminar and turbulent(vortex) flow. The transition from one type of flow to another is determined by a dimensionless quantity called the Reynolds number:
Re = ρ < υ > d/ η = < υ > d/ ν , (6)
where ρ is the liquid density,<υ>is the liquid velocity averaged over the vessel cross section, d is the vessel diameter, ν=η/ρ is the kinematic viscosity.
The critical value of the Reynolds number Rekr
For homogeneous liquids, Recr = 2300, for blood, Recr = 970±80, but even at Re >400, local eddies appear in the branches of the arteries and in the area of their sharp bends.
Poiseuille's formula, for volumetric blood flow velocity:
Q = π r4 Δ p/8 η l, (7)
where Q is the volumetric blood flow velocity, r is the radius of the vessel, Δp is the pressure difference at the ends of the vessel, η is the blood viscosity.
It can be seen that under given external conditions (Δp), the more blood flows through the vessel, the lower its viscosity and the greater the radius of the vessel.
The Poiseuille formula can also be given the following form:
Q = Δ p/ RG., (8)
In this case, Poiseuille's formula reveals similarities with Ohm's law.
Rg = 8ηl/πr4 reflects the resistance of the vascular bed to blood flow, including all the factors on which it depends. Therefore, Rg is called hemodynamic resistance (or total peripheral vascular resistance).
The hemodynamic resistance of 3 vessels connected in series and in parallel is calculated by the formulas:
RG= RG1 + RG2 + RG3 , (10)
RG= (1/ RG1 + 1/ RG2 + 1/ RG3 ) -1 (11)
From the analysis of the branched vascular tube model, it follows that contribution of large arteries toRGinsignificant, although the total length of all large-diameter arteries is relatively large.

The emergence and propagation of a pulse wave
along the walls of the vessels due to the elasticity of the aortic wall. The fact is that during the systole of the left ventricle, the force that occurs when the aorta is stretched by blood is not directed strictly perpendicular to the axis of the vessel and can be decomposed into normal and tangential components. The continuity of blood flow is provided by the first of them, while the second is the source of the arterial impulse, which is understood as the elastic oscillations of the arterial wall.
The pulse wave propagates from the place of its origin to the capillaries, where it decays. The speed of its propagation can be calculated by the formula:
υ P= (E b/2 ρ r) 1/2 , (12)
where E is the Young's modulus of the vascular wall, b is its thickness, r is the radius of the vessel, ρ is the density of the tissues of the vascular wall.
Pulse wave speed can be taken as a quantitative indicator of the elastic properties of elastic type arteries - those properties due to which they perform their main function.
The speed of the pulse wave in the aorta is 4 - 6 m/ With, and in the radial artery 8 – 12 m/ With. With sclerotic properties of the arteries, their stiffness increases, which is manifested in an increase in the speed of the pulse wave.
Sphygmography
(Greek sphygmos pulse, pulsation + graphō write, depict) - a method for studying hemodynamics and diagnosing some forms of pathology of the cardiovascular system, based on graphic registration of pulse oscillations in the wall of a blood vessel.
Sphygmography is carried out using special attachments to an electrocardiograph or other registrar, which make it possible to convert the mechanical vibrations of the vessel wall perceived by the pulse receiver (or the accompanying changes in the electrical capacitance or optical properties of the studied area of the body) into electrical signals, which, after preliminary amplification, are fed to the recording device. The recorded curve is called a sphygmogram (SG). There are both contact (applied to the skin over the pulsating artery) and non-contact, or remote, pulse receivers. The latter are usually used to register a venous pulse - phlebosphygmography. The recording of pulse oscillations of a limb segment with the help of a pneumatic cuff or strain gauge applied around its perimeter is called volumetric sphygmography.
Sphygmography is used as an independent research method or is part of other techniques, such as mechanocardiography, polycardiography. As an independent method, S. is used to assess the state of the arterial walls (by the speed of propagation of the pulse wave, the amplitude and shape of the SG), the diagnosis of certain diseases, in particular valvular heart disease, and the non-invasive determination of the stroke volume of the heart using the Wetzler-Beger method. In terms of diagnostic value, S. is inferior to more advanced methods, such as X-ray or ultrasound methods for examining the heart and blood vessels, but in some cases it provides valuable additional information and, due to its ease of execution, is available for use in a polyclinic.

Rice. 1. Sphygmogram of the carotid artery is normal: a- atrial wave; b-With- anacrota; d- late systolic wave; e-f-g- incisura; g- dicrotic wave, i- preanacrotic tooth; be- period of exile; ef- protodiastolic interval.
Arterial sphygmogram reflects fluctuations in the arterial wall associated with changes in pressure in the vessel during each cardiac cycle. Allocate a central pulse, reflecting pressure fluctuations in the aorta (SG of the carotid and subclavian arteries), and peripheral pulse (SG of the femoral, brachial, radial and other arteries).
On the normal SG of the carotid artery ( rice. one ) after low-amplitude waves a(reflects atrial systole) and a tooth i(occurs due to isometric tension of the heart) there is a steep rise in the main wave b-With- anacrot, due to the opening of the aortic valve and the passage of blood from the left ventricle into the aorta. This rise is replaced at a point with a descending part of the wave - a catacrot, which is formed as a result of the predominance of outflow of blood over inflow in a given period in a vessel. At the onset of catacrosis, a late systolic wave is determined d followed by an incisura efg. During ef(protodiastolic interval) the aortic valve slams, which is accompanied by an increase in pressure in the aorta, forming a dicrotic wave g. Time interval represented by a segment b-e, corresponds to the period of expulsion of blood from the left ventricle.
SG of peripheral arteries differ from the curves of the central pulse by more rounded outlines of the top of the main wave, the absence of waves a and i, sometimes incisura, a more pronounced dicrotic wave, often the appearance of a second diastolic wave. The interval between the peaks of the main and dicrotic waves of the femoral pulse corresponds, according to Wezler and Beger (K. Wezler, A. Böger, 1939), to the time of the main oscillation of the arterial pulse and is used to calculate the stroke volume of the heart.
When evaluating the form of arterial SH, they attach importance to the steepness of the growth of anacrota, the nature of its transition to catacrot, the presence and location of additional teeth, and the severity of the dicrotic wave. The shape of the curves of the central pulse largely depends on the peripheral resistance. With low peripheral resistance, the SG of the central arteries have a steeply rising anacrot, sharp apices, and deep incisura; with high peripheral resistance, the changes are opposite.
The absolute values of the amplitudes of the individual components of the SG are usually not evaluated, since the S. method has no calibration. For diagnostic purposes, the amplitudes of the SG components are correlated with the amplitude of the main wave. Similarly, instead of assessing the absolute values of the SG time intervals, their ratio as a percentage with the total duration of the systolic wave is used; this allows temporal analysis of SG regardless of heart rate.
Synchronously recorded CG of the central and peripheral pulses are used to determine the speed of propagation of the pulse wave through the arteries; it is calculated as the quotient of dividing the length of the wave path by the duration of the interval between the beginnings of the anacrotic pulse of the studied arteries. The speed of propagation of the pulse wave in the aorta (elastic vessel) is calculated from the SG of the carotid and femoral arteries, in peripheral arteries (vessels of the muscular type) - from the volumetric SG recorded on the shoulder and lower third of the forearm or on the thigh and lower third of the leg. The ratio of the speed of propagation of a pulse wave through the vessels of the muscular type to the velocity of propagation of a pulse wave through the vessels of the elastic type in healthy people is in the range of 1.1-1.3. The speed of propagation of the pulse wave depends on the modulus of elasticity of the arterial wall; it increases with an increase in the tension of the arterial walls or their compaction and changes with age (from 4 m/s in children under 10 m/s and more in persons over 65 years of age).
Phlebosphygmogram usually recorded from the jugular vein. The main elements of the SG of the jugular vein are normally represented by positive waves a, With, d and negative - X-, at-collapses ( rice. 2 ). Wave a reflects the systole of the right atrium, wave c is due to the impact on the jugular vein of the pulsation of the carotid artery. Before the wave With sometimes a tooth appears b, coinciding in time with the isometric tension of the ventricles of the heart. Formation X-collapse on the segment a-b due to atrial diastole, in the segment b-X- rapid emptying of the vena cava into the right atrium as a result of pulling down the atrioventricular septum during right ventricular systole, as well as a decrease in intrathoracic pressure due to the expulsion of blood into the abdominal aorta. Next positive wave d due to the filling of the vena cava and the right atrium with blood when the tricuspid valve is closed. After the valve opens, blood from the right atrium rushes into the right ventricle, which contributes to the emptying of the vena cava, diastolic at-collapse. As the right ventricle is filled with blood, the rate of emptying of the atrium decreases, the pressure in it increases, the blood filling of the veins increases again from about the middle of the diastole of the ventricle, which is reflected by the appearance of the second diastolic wave on the phlebosphygmogram d(stagnant wave).

Rice. 2. Phlebosphygmogram of the jugular vein is normal: a - atrial wave; b - tooth, reflecting the isometric tension of the ventricles; c - transmission wave of the pulse of the carotid artery; d, d" - diastolic waves; x - systolic collapse; y - diastolic collapse.
Diagnostic value. Pathological changes in arterial SH in some diseases have a certain specificity. With stenosis of the aortic mouth, notches (anacrotic pulse) appear on the anacrote of the central SG, the time of anacrotic rise is lengthened, sometimes the curves take the form of a cockscomb ( rice. 3, a ). With hypertrophic subaortic stenosis (see Cardiomyopathy), the time of anacrotic rise is shortened, the ratio of the duration of anacrotic and exile decreases. Aortic valve insufficiency is manifested by a sharp increase in the amplitude of all waves, smoothing or disappearance of incisura on the SG of the central arteries ( rice. 3b ), the appearance of high-frequency oscillations on the anacrot of the femoral pulse ( rice. 3, in ) and on all volumetric CGs of the lower extremities. With coarctation of the aorta, the amplitude of the central SH and volumetric SH of the upper limbs is increased, the duration of the SG of the carotid artery is shortened, the top of the pulse wave is split; CG of the femoral artery and voluminous CG of the lower extremities are low-amplitude dome-shaped waves devoid of dicrote (triangular pulse, rice. 3, g ). Obliterating and occlusive lesions of the peripheral arteries are manifested in volumetric SGs recorded below the site of occlusion by a decrease in the amplitude of pulse waves (in severe cases, a straight line is recorded) and the absence of sputum (monocrotic pulse). In case of damage to the vessel of one limb or uneven obliteration of the arteries in cases of their systemic damage, there is a difference in the amplitudes and shapes of the pulse curves on symmetrical arteries. The predominance of collateral depends on the heart rate; with tachycardia wave d reduced, wave d" missing.
Technical implementation of the photoplethysmography method,
registered signal parameters.
Finger photoplethysmography.
The organ under study is the terminal phalanx of the hand or foot.
(in the distal phalanges of the fingers and toes, the most intense values of arterial and venous circulation.)

Anacrota– ascending section of the pulse wave
The descending portion of a pulse wave is called catacrot.
On the downside there is a wave called dicrotic caused by the closing of the semilunar valves between the left ventricle and the aorta.
(BUT2 ) It is formed due to the reflection of blood volume from the aorta and large
main vessels and partly corresponds to the diastolic period of the cardiac cycle.
The dicrotic phase carries information about vascular tone.
The top of the pulse wave corresponds to the largest volume of blood, and its opposite part corresponds to the smallest volume of blood in the examined tissue area.
The frequency and duration of the pulse wave depend on the characteristics of the heart, and the magnitude and shape of its peaks– from the state of the vascular wall.

Waves of the first order (I), or volumetric pulse
Waves of the second order (II) have a period of respiratory waves
Waves of the third order (III) are all recorded oscillations with a period greater than the period of the respiratory waves
Use of the photoplethysmography method in medical practice.
Basic option.
After applying a clothespin sensor to the distal phalanx of the finger or toe and activating the registration of the photoplethysmogram in the interface part of the device, a sequential measurement of the volumetric pulse values is performed in various phases of the study of the effect of the studied factor on the human body. Examination of the volumetric pulse with a change in the position of the limb.
Mechanism: Change in vascular arterial reflexes at different positions of the limb - the prevalence of the vasodilating reflex when the limb is raised up, when the limb is lowered down, the vasoconstrictive reflex prevails.
With the development of the vasoconstrictor effect, the amplitude of the pulse waves increases, with the development of the vasodilating effect, the amplitude of the pulse waves decreases.
It is possible to identify the mobility of the mechanisms that regulate the distribution of blood, which is essential in identifying local capillary disorders and vascular diseases at the level of the whole organism.
Occlusal photoplethysmography technique
consists in the following: at the level of the upper third of the shoulder, a tonometric cuff is applied and air is injected into it to a pressure of 30 mm Hg. st higher than blood pressure. The pressure in the cuff is maintained for 5 minutes, then the air is quickly vented. During the first 30 seconds, the peak volumetric and linear blood flow velocity normally occurs, gradually decreasing by the 3rd minute.
The technique for determining blood pressure in the brachial artery using photoplethysmography.
Decompression option:
Air is pumped into a rubber cuff connected to a manometer until the peripheral pulse disappears. The air is then expelled at a constant rate. When the pressure in the cuff matches the arterial pressure, the volume of blood in the finger increases, which is manifested by the appearance of a pulsation; when the pressure matches the venous pressure, the blood volume decreases again. According to experimental data, this method of recording blood pressure is the most accurate and can be used when it decreases.
The studied parameters of the photoplethysmogram:
vertical axis the amplitude characteristics of the pulse wave corresponding to the anacrotic and dicrotic periods are studied. Despite the fact that these parameters are relative, their study in dynamics provides valuable information about the strength of the vascular response. In this group of signs are studied:
1. amplitude of anacrotic and dicrotic waves,
The latter indicator has an absolute value and has its own standard indicators.
On the horizontal axis the temporal characteristics of the pulse wave are studied, providing information on the duration of the cardiac cycle, the ratio and duration of systole and diastole. These parameters have absolute values and can be compared with existing normative indicators.
 |
Pulse wave amplitude or anacrotic phase (APV), defined on the vertical axis as: APV = B2-B1.
l Has no normative values, it is estimated in dynamics.
Dicrotic wave amplitude(ADV), is defined along the vertical axis as: ADV = B4-B5.
l Normally is 1/2 of the amplitude of the pulse wave.
Dicrotic Wave Index(IDV), is defined as a percentage as: IDV \u003d ((B3-B5) / (B2 - B1)) 100
lThe standard value is %.
Duration of the anacrotic phase pulse wave (PWF), defined in seconds on the horizontal axis as: PWF = B3-B1
Duration of the dicrotic phase pulse wave (PWF), is defined in seconds on the horizontal axis as: PWF = B5-B3.
lThe standard value has not been established.
Pulse Wave Duration(DPA) , is defined in seconds on the horizontal axis as: DPV = B5-B1.
l Normative values for age groups:
Age, years | Pulse wave duration, sec |
The duration of the systolic phase cardiac cycle (CV) is defined in seconds on the horizontal axis as: CV = B4-B1.
l The normative parameter is calculated, it is equal to the product of the DPV duration and 0.324.
The duration of the diastolic phase cardiac cycle (DD) is defined in seconds on the horizontal axis as: DD = B5-B4.
l Normally equal to the remainder of the subtraction of the duration of systole from the total duration of the pulse wave.
Heart rate(HR), defined in beats per minute as: HR = 60 / DPV.
l Normative values of heart rate according to Kassirsky:
Age, years | Heart rate in min |
Methods of clinical photoplethysmography (part 3).
Qualitative criteria for evaluating photoplethysmograms.
The listed quantitative indicators do not provide comprehensive information about the nature of the pulse wave. Of no small importance is the qualitative assessment of the shape of pulse waves, which is often of decisive importance. When analyzing the shape of pulse waves, terms borrowed from clinical practice are used, such as pulsus tardus, pulsus celer.
With increased peripheral resistance, for example, with a combination of atherosclerosis and hypertension, and especially in patients with aortic stenosis, the shape of the pulse waves corresponds to pulsus tardus: the rise of the pulse wave is gentle, uneven, the top shifts towards the end of systole (“late systolic protrusion”).
https://pandia.ru/text/78/415/images/image011_47.gif" height="1 src=">
Fig 4 Pulse wave typepulsus tarduswith increased peripheral resistance.
With low peripheral resistance and large systolic ejection, characteristic of patients with aortic insufficiency, pulse waves look like pulsus celer: the rise of the pulse wave has a steep rise, a rapid decline and an incisura that is hardly noticeable. Between the localization of the incisura, the value of peripheral resistance and the elastic state of the arteries, there is a certain relationship: with reduced elasticity of the vessels, the incisura approaches the top, and with vasodilation it does not go beyond the lower half of the pulse curve.
https://pandia.ru/text/78/415/images/image013_12.jpg" width="397" height="132">
Fig 6. Symptom of "cockscomb". Symptoms are obtained at the time of excessive exposure to a dose of infrared therapeutic laser.
https://pandia.ru/text/78/415/images/image015_14.jpg" width="225" height="110">
Fig 8. Step at the top of the pulse wave.
https://pandia.ru/text/78/415/images/image017_14.jpg" width="339" height="254 src=">
Fig. 10. Absence of a dicrotic wave on a pulsogram in a patient with diabetes mellitus.
In addition, the following pathological abnormalities have been registered in various diseases:
r the absence of a dicrotic tooth indicates the presence of atherosclerosis, hypertension
(fig 10);
r difference in the volumetric pulse in the arms and legs may indicate coarctation of the aorta;
r too large volumetric pulse - perhaps the patient has an open ductus ductus;
r with obliterating endarteritis, the amplitude of pulse waves is reduced on all fingers of the affected limb;
r when performing a functional test with a change in the position of the limb in patients in the initial phase of obliterating endarteritis, the vasodilating effect is sharply reduced when lifting the leg (low amplitude of pulse waves) and the vasoconstrictive effect is significantly pronounced when lowering the leg;
r when performing a functional test with a change in the position of the limb in patients with obliterating atherosclerosis in the stage of subcompensation when lowering the limb, the amplitude of the pulse waves decreases significantly.
Sex and age features of photoplethysmograms:
1. In the period from 8 to 18 years, the amplitude of the pulse wave tends to increase, from 19 to 30 years it stabilizes, after 50 the amplitude of the pulse wave increases again.
2. According to observations (1967), pulse waves in children are distinguished by a steep rise. The apex of the curve has a rounded outline. Incisura in 72% of healthy children is located in the upper or middle third of the pulse wave, in 28% - in the lower third of the pulse wave. In the vast majority of children, the incisura and the initial diastolic wave are clearly expressed.
3. Gender differences - in girls under 16 years of age, compared with boys, the amplitude of the pulse wave is higher.
Other features of photoplethysmograms:
1. The value of the volumetric pulse does not depend on the time of year, but vascular reactions are more easily caused in July and August (Hetzman 1948).
2. With magnetic storms, the passage of atmospheric fronts and other weather fluctuations, large fluctuations in the peripheral capillary circulation occur, especially in patients with rheumatism - the number of reactions indicating vasodilation increases. In the control measurement during physiotherapeutic procedures, there is a clear decrease in the non-damaging dose of the physical factor.
One of the most important exercises, without which all other exercises do not make sense, is " pulse wave". This exercise plays an important role not only in the health part, but also in the combat part, although the exercise itself is one of the simplest.
In order to perform a pulse wave, we first learn to listen to our pulse. There are two ways to feel the pulse.
The first used by physicians. This method, for example, was taught to us in the therapeutic gymnastics classes that I attended before giving birth:
We press the radial artery on the wrist with our fingers. Under the fingers we feel pulsating tremors of blood. Listen to these beats for a while, then try to hear your heart as it pushes the blood out, and you can even "see" it contract and expand as it pushes the blood on its journey through the arteries.
Now there are many films in which they showsecond way listening to the pulse. In Slavic gymnastics, this method is given a special semantic meaning. This is the carotid artery.
Since Slavic gymnastics is a Cossack practice, which means it was originally a combat one, it was the point on the carotid artery that was given a very important, and even mystical, meaning.
In all martial practices, the area of the carotid artery is considered deadly. Even a light touch to it causes an instinctive feeling of fear. Therefore, by frequently touching this point in the exercise, this feeling of fear of death gradually weakens, as any vaccination reduces the risk of disease.
Let's find this point first. Touch the neck under the chin. Below is the larynx, protected by cartilage. Gently feel the cartilage and define the boundaries, starting from the top under the jaw and down to the jugular fossa. Also, gently run your fingers on both sides of the anterolateral neck muscle. It is clearly defined from the inner corner of the collarbone to the earlobe, if the head is turned slightly to the side.
Just on the border between this muscle and cartilage, there is a soft cavity, and in it is the carotid artery. We divide the cavity from the ear to the collarbone into 3 parts. The point we are looking for is between the top and middle parts. At this point, we press the artery with the index or thumb, you can use the index and middle fingers at the same time, from the bottom up and inward, a little diagonally. I fight, we feel the pulse beat.
We have learned how to find a pulsating point and can move on to the main thing:
doing the exercise.
The whole point of this exercise is breathing, the rhythm of which is set by our pulse.
We continue to listen to the pulse with our fingers, and begin to breathe in the following rhythm: 4 heartbeats - inhale, 4 beats - exhale. It will be hard. For some reason, my pulse initially tried to “run away”.
When the breath merges with the beats of the heart, and you remember its rhythm, you can remove your fingers from the pulsating point and continue to breathe from memory in the same rhythm.
We connect our figurative thinking to work. Inhaling, for 4 heart beats, expand, exhaling, also for 4 beats, we collect Vedogon in the center of the Yar. You can help your consciousness and Vedogon with real movements. Inhaling, I spread my arms, physically feeling how Vedogon expands, and exhaling, with my hands I help Vedogon concentrate in the center of the Yar.
Exercise to perform 5-7 minutes. An important goal of the exercise has been achieved: consciousness, energy, breathing and body are synchronized. But at the same time, the main goal was also achieved - the vibrations of our Vedogon and the vibrations of the Universe came into harmony.
Remember, in the article “The Structure of the Vedogon” another name was given: “settled bubble ". In the East it is called the Microcosmos, and the Universe is called the Macrocosmos. The Universe is also a “Settler Bubble”, because we, living beings, are settled in it. Therefore, both the individual and the Universe have the same properties. The difference is only in size and power.
The universe is a large pulsating organism. Each of us is the same pulsating Universe, with its own individual rhythm.
We have already said that the central axis of rotation of this individual Universe, Meru (or Svil), passes through Yar. The center of the Yar is our heart, therefore its expansion and contraction (diastole and systole) is simultaneously an expansion and contraction of the Cosmic “Settlement Bubble”.
For our health, the rhythm of this pulsation is very important: expansion on inspiration for 4 heart beats, and compression on exhalation, for 4 heart beats. Violation of this rhythm, this harmony leads not only to disease, but also to death.
Why is it desirable to start with "Pulse" every day?
With the help of the “Pulse” exercise, we enter into harmony with the pulsation of the Universe and begin to fill ourselves with its infinite energy, because 4–4 is the general universal rhythm.
In principle, the entire even series of numbers enriches energy, gives it away, shares it with us, fills it with vigor, activates all processes. But we will use only three numbers in the exercise: 2, 4, 8 .
Practice "Pulse" in a 4-4 rhythm until the exercise is effortless. Then, in turn, we also perform the exercise in more complex variants until complete mastery.
- Inhale for 4 heart beats - expand; holding the breath for 2 beats - the expansion continues by inertia; exhale for 4 beats - squeeze Vedogon. The execution time is the same.
- Inhale for 4 heart beats - expand; holding the breath for 2 beats - the expansion continues by inertia; exhale for 4 beats - squeeze Vedogon; holding the breath for 2 beats with concentration in the center of the Yar.
- More difficult option: inhale for 8 beats (expansion); breath holding for 4 beats; exhale for 8 beats (compression).
- And the last: inhale for 8 beats (expansion); breath holding for 4 beats; exhale for 8 beats (compression); hold your breath for 4 beats.
The last two options are already for the well advanced. The second option is enough for us.
Once again about the extension. Do not overdo it. You yourself know the possibilities of your imagination, it is it that will indicate the boundaries. The more training there is, the better the imagination will work and the further Wedogon will be able to expand.
And one more thing to doto be done after completing the exercise: thissnapping off. Having learned how to perform it, we get an instant shutdown tool. For example, if we feel an attempt to take away energy, or an energy-information strike, or simply unpleasant sensations after a meeting or conversation, and also, in order to disconnect from the mental image, it is enough to click off.
The technique is very simple. Inhaling, raise your hands with your palms to eye level, crossing them at the wrists. Tightly press the thumbs and middle fingers with the nail phalanges. At the same time, we exhale sharply and throw our hands down - to the sides, making a snap of our fingers. We perform the action 1-3 times, if necessary.
Already at this initial stage, you can use the "Pulse Wave" inmedicinal purposes.
Many people know how much trouble various arrhythmias bring: whether it is a rapid or slow heartbeat, it causes tangible suffering.
So here it is heart rate can be adjusted , and for this you need a small instrument that is known to all musicians. Whether it's a metronome, mechanical or electronic, it doesn't matter.
Set up the metronome so that it makes 1 beat per second (or 60 per minute). This rhythm is considered normal for a person.
Get comfortable sitting in a chair or lying down and measure your heart rate. This can be done using a tonometer, or you can do it yourself, manually. If someone doesn't know how, I'll tell you how.
We press the radial artery on the wrist with three fingers and, feeling the pulse beat, turn on the stopwatch. We count how many beats there are in 10 seconds, and multiply the resulting number by 6. So we got the number of our heart rate. We remember her.
Relax and remove unnecessary thoughts. To make it easier, focus on something specific. For example, imagine an image of a heart, fill it with white gold. Only this will begin to have a healing effect.
And it is very important to enter the state of "mzhi" (or "boundary"). This state is borderline between sleep and wakefulness. We all find ourselves in this state from time to time, so we can remember it. Early morning, you are no longer sleeping, but you have not yet woken up. It is very important to learn how to enter this state of your own free will, that is, consciously.
As soon as you feel that you are already in this state, turn on the metronome. We perform a "pulse wave" in the rhythm set by the metronome. Merge with the rhythm of the metronome, immerse yourself in it, color it in a color that is comfortable for you, you can even give it a pleasant taste and smell. Everything that your imagination is capable of in this state of "between".
You yourself will feel when it will be possible to exit the state and stop working.
Again we measure the pulse and make sure that it is normal: 60 beats per minute.
Of course, in order to cope with arrhythmia on your own and forever, you need to do this practice for quite a long time.